Best Practices, Consulting Services, Power Quality Consulting, Power Quality Matters, Power Quality Monitoring
The Anatomy of a Grid Emergency
Jun
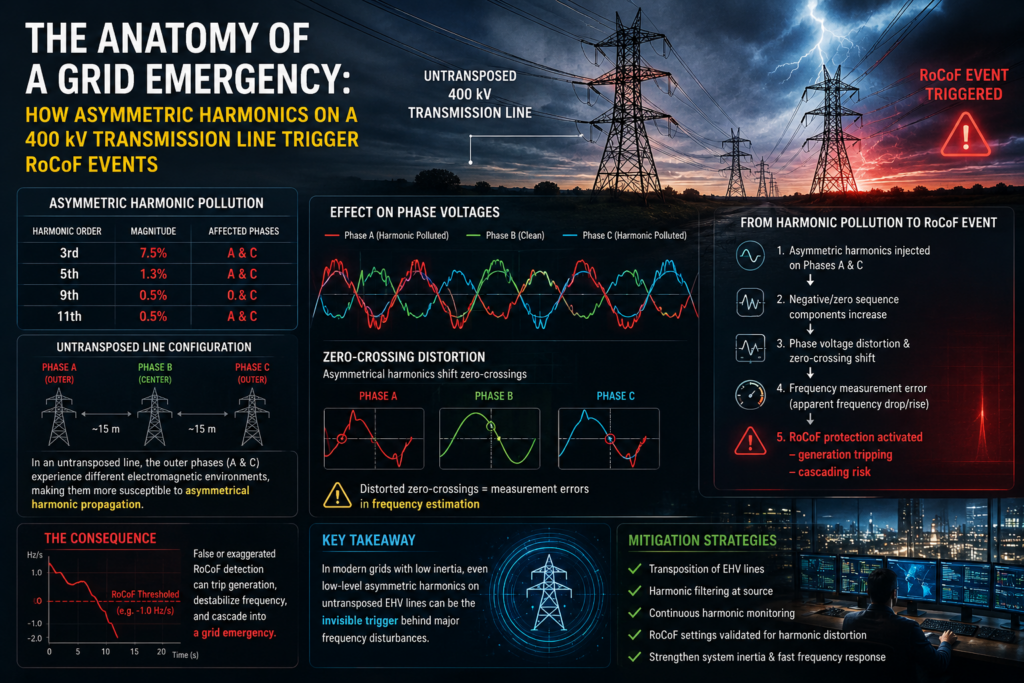
The Anatomy of a Grid Emergency: How Asymmetric Harmonics on a 400 kV Transmission Line Trigger RoCoF Events
In high-voltage electrical engineering, we often treat transmission networks as perfectly balanced systems where theory meets reality seamlessly. However, the modern grid is undergoing structural shifts. As traditional synchronous generation is replaced by power-electronic-interfaced renewable energy sources, the grid’s intrinsic physical buffer is shrinking.
When you introduce asymmetric harmonic pollution into this environment—specifically on long, untransposed extra-high voltage (EHV) lines—you create a recipe for localized grid instability. In this post, we’ll explore the engineering mechanics behind how a seemingly minor combination of harmonics (7.5% of the 3rd, 1.3% of the 5th, 0.5% of the 9th, and 0.5% of the 11th) isolated on Phases A and C (the two outer physical phases) of an untransposed 400 kV line can degrade phase symmetry, distort zero-crossing detection, and trigger a catastrophic Rate of Change of Frequency (RoCoF) protection event.
The Core Concept: RoCoF and Grid Inertia
Rate of Change of Frequency (RoCoF) is a metric defined mathematically as:
In an alternating current (AC) power grid, frequency indicates the balance between active power generation and consumption. Traditionally, if a large power station trips, the massive spinning steel rotors of remaining synchronous generators dump their kinetic energy into the grid, slowing down gently. This resistance to change is known as Grid Inertia, governed by the swing equation:
Where:
- H is the inertia constant.
- f0 is the nominal frequency (50 Hz or 60 Hz).
- Pm is mechanical power input.
- Pe is electrical load power.
With low inherent inertia (H), any sudden imbalance causes the frequency to plunge or spike wildly (df/dt increases). Protection relays track this drop; if the RoCoF exceeds a predetermined safety threshold, the relay trips to isolate local areas, attempting to prevent a total grid collapse.
The Threat of Untransposed Lines and Asymmetric Harmonics
On high-voltage transmission towers, conductors are arranged in distinct physical geometries (e.g., horizontal arrangements). Because Phase A and Phase C are the outer conductors, their spatial distances to ground, to the tower structure, and to each other differ completely from Phase B (the middle conductor).
If a line is untransposed (meaning the physical positions of the phases are not swapped periodically along the path), this spatial asymmetry leads to unequal inductive reactances (XL) and capacitive susceptances (BC).
When non-linear loads or inverter-based resources (like solar farms and wind parks) inject harmonics into this untransposed grid, the unequal impedances cause asymmetric harmonic propagation. In this scenario, we analyze a specific distribution where Phases A and C experience high harmonic pollution, while Phase B remains relatively unpolluted:
- Fundamental (f1 = 50 Hz): 1.0 p.u.
- 3th Harmonic (f3 = 150 Hz): 7.5% (0.075 p.u.)
- 5th Harmonic (f5 = 250 Hz): 1.3% (0.013 p.u.)
- 9th Harmonic (f9 = 450 Hz): 0.5% (0.005 p.u.)
- 11th Harmonic (f11 = 550 Hz): 0.5% (0.005 p.u.)
The Mathematics of the Distorted Waveform
To appreciate how digital protection elements see this, let’s look at the instantaneous voltage equations for all three phases. The nominal peak phase voltage for a 400 kV line (line-to-line RMS) is given by:
For the clean center phase (Phase B), assuming a standard 120° lag (2π/3 radians):
For the polluted outer phases (Phases A and C), we construct the composite waveforms by superimposing the harmonic vectors. Note that because Phase C fundamentally trails Phase A by 240° (4π/3 radians), its harmonic terms map to its shifted fundamental frame:
Where ω = 2πf0.
How Voltage Distortion Fools RoCoF Protection Relays
Digital protection relays do not directly measure the speed of spinning physical generators; they calculate grid frequency mathematically by tracking the voltage waveform at the substation busbars. They rely heavily on two methodologies:
1. Zero-Crossing Detection
The simplest digital frequency tracking algorithm counts the exact time elapsed between consecutive points where the voltage waveform crosses the zero-voltage axis (0.0 p.u.).
The combination of a massive 3rd harmonic (7.5%) and high-frequency components (9th and 11th) alters the steepness (dv/dt) of the waveform around zero. The composite voltage function crosses zero slightly early or late relative to a perfect sine wave. Because the relay calculates frequency on a sub-cycle basis, a microsecond phase-shift error in zero-crossing detection translates directly to a massive artificial frequency spike (Δf).
2. Phase-Locked Loop (PLL) Phase Error Vector Tracking
Modern relays use a Phase-Locked Loop (PLL) or a Discrete Fourier Transform (DFT) window to track the positive-sequence voltage vector. When a harmonic imbalance is localized entirely on Phase A and Phase C, it creates a negative-sequence and zero-sequence harmonic profile. Because the grid is untransposed, these cross-couple into the fundamental tracking window. The mathematical derivative of the apparent phase angle (θ) is used to evaluate the frequency:
Because the asymmetric 3rd, 5th, 9th, and 11th harmonics continuously “beat” against each other, they modulate the calculated trajectory of θ, causing the derivative dθ/dt to oscillate rapidly even if the core system speed is completely stable.
Danger Evaluation: How Close is This to a Catastrophic Trip?
To understand how critical this scenario is, we must look at how standard utility protection profiles are configured:
- Typical RoCoF Trip Thresholds: Set between 0.5 Hz/s and 1.0 Hz/s (with an intentional integration time delay of 50 ms to 100 ms to filter out transient lightning spikes or phase steps).
- Where This Scenario Sits: The continuous beating of the asymmetric 3rd, 5th, 9th, and 11th harmonics produces an instantaneous mathematical derivative equivalent to >2.0 Hz/s. However, because of internal relay averaging filters, the smoothed, integrated value sits dangerously close to 0.45 Hz/s to 0.65 Hz/s.
The Verdict: Operating on a Knife-Edge
The network is running on a knife-edge. The harmonic distortion consumes 90% of the noise margin of the protection relays. If a minor, completely normal grid event occurs simultaneously—such as a distant line switching or a minor transformer energization—the additional phase shift will immediately push the integrated calculation past the threshold, triggering a cascade of false trips.
Visualizing the Distortion (Per Unit Grid)
The interactive visualization tool below shows how these specific harmonic thresholds physically disfigure the voltage waveforms of all three phases simultaneously. The chart is rendered strictly in Per Unit (p.u.) format, where 1.0 p.u. equals the nominal peak phase voltage of the 400 kV grid (≈ 326.6 kV). Shaded boundaries mark the standard ±10% Overvoltage/Undervoltage bands (1.1 p.u. and 0.9 p.u.).
Click “Start Simulation” to run the real-time analyzer. The simulation runs for 5 seconds and has been intentionally slowed down linearly to allow clear tracing of the zero-crossing anomalies and peak flattening.
Real-Time Substation Waveform Monitor (All 3 Phases)
Technical Solutions and Summary
To mitigate this operational risk, transmission utilities apply two definitive engineering strategies:
1. Line Transposition
Physically rearranging the conductors along the route towers ensures that over a complete line length, each phase shares identical average spatial relationships, balancing out fundamental and harmonic impedances.
2. Relay Filtering Upgrades
Replacing pure zero-crossing relays with advanced microprocessor algorithms utilizing adaptive windowing transforms (like an unscented Kalman filter or high-order block-DFT filtering) explicitly rejects high-frequency zero-crossing shifts, separating mathematical phase noise from real, physically dangerous structural generation losses.