
Best Practices, Power Quality Consulting, Power Quality Matters, Power Quality Monitoring
Voltage Unbalance: Why 2% Quietly Burns Your Motors
Sep
Power Quality
The 2% Problem: Why Your Power Quality Report Says Everything Is Fine While Your Motors Quietly Burn
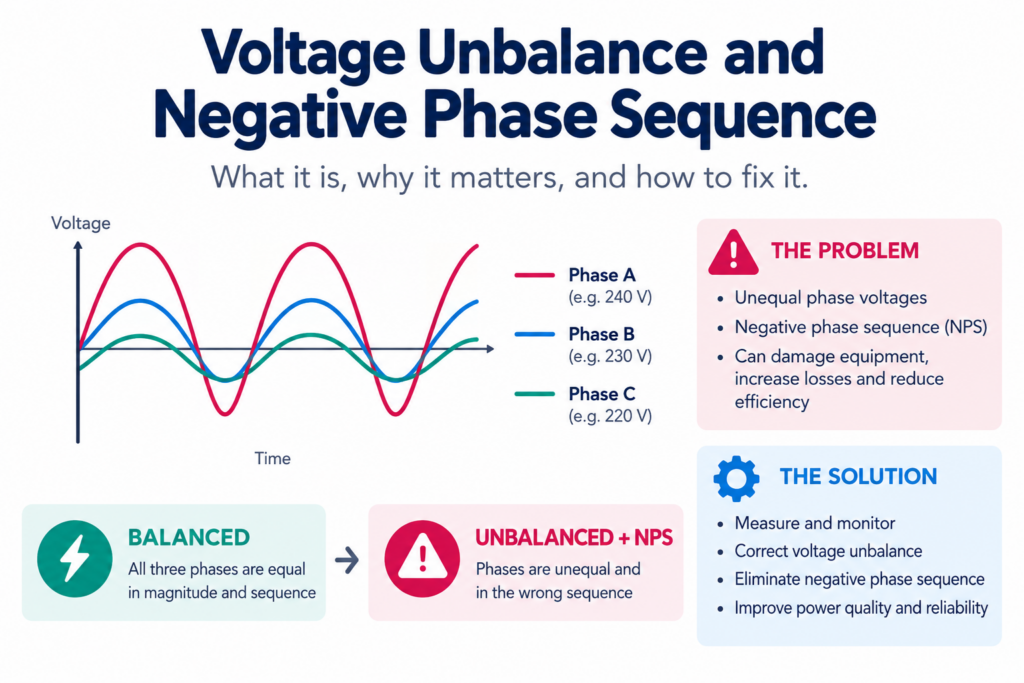
Voltage unbalance is the most under-instrumented parameter in power quality and, per unit of measured magnitude, one of the most destructive. Here is how a number small enough to pass every compliance test in force manages to cook rotors, kill drive capacitors, melt neutral conductors and heat transformer tank walls — and why the way we measure it guarantees we will not see it happen.
A plant manager calls you because three identical motors on the same busbar have failed in eighteen months. The maintenance file shows nothing unusual. The bearings were fine. The alignment was checked. The last power quality survey, done properly with a Class A instrument, came back clean: voltage unbalance sitting comfortably at 1.4%, well inside the 2% compatibility level, with no exceedances flagged for the entire monitoring week.
Everything in that file is accurate. And everything in that file is beside the point.
The uncomfortable truth about voltage unbalance is that the number on the report and the stressor inside the machine are two different quantities, separated by a chain of averaging operations that were designed for a phenomenon that behaves very differently from the one causing the failures. A voltage unbalance factor of a few percent — a value that passes almost every regulatory test in force — produces negative-sequence stator currents of 40% to 64% of rated current in modern induction motors. It halves winding insulation life through a temperature rise that scales with the square of unbalance. It forces three-phase rectifier front ends into quasi-single-phase conduction. It more than doubles cable losses where a neutral is present. And it pushes zero-sequence flux into transformer tank walls where no core path exists to carry it.
None of this is secret. All of it is documented in standards that engineers cite routinely. What is missing is a measurement and enforcement chain fast enough to act on any of it.
First, a definition problem hiding in plain sight
Three definitions of unbalance coexist in everyday practice, and they are not interchangeable. This is not pedantry — the choice of definition determines whether you can see the problem at all.
The true definition, and the only one with a physical basis, is the ratio of the negative-sequence to the positive-sequence voltage component:
VUF = (V₂ / V₁) × 100%
The NEMA Line Voltage Unbalance Rate does something different. It takes the maximum deviation of any line voltage from the average of the three, divided by that average. The IEEE Phase Voltage Unbalance Rate runs the same computation on phase voltages. Both discard phase-angle information entirely, which means neither can distinguish a magnitude-only unbalance from an angular displacement that produces identical magnitudes but a substantially different negative-sequence component (University of Cape Town thesis on voltage unbalance).
That distinction matters because the negative-sequence component is the thing that does the damage. Everything else is a proxy. The IEEE motor protection guide states the consequence about as plainly as a standards document ever states anything:
It is the negative-sequence component that actually jeopardizes the motor… Hence, simple unbalance measurements may not provide the degree of motor protection required. IEEE Std C37.96-2000, clause 5.7.2.3
Read that sentence twice, because it undercuts a great deal of routine practice. If your protection scheme, your trend log, or your acceptance test is built on line-voltage deviation ratios rather than sequence decomposition, you are measuring a shadow of the stressor and inferring the stressor from the shadow.
There is also a structural mismatch buried in the limits themselves, and once you see it you cannot unsee it.
| Framework | Quantity | Stated value |
|---|---|---|
| IEC 60034-1:2017, clause 8.3.1 / IEEE 112-B | Unbalance permitted during motor thermal and efficiency testing | Below 0.5% (IEC 60034-1) |
| IEC 60034-1:2017, clause 7.2.1.1 | Negative-sequence voltage at motor terminals, continuous | 1% of positive sequence; 1.5% for a few minutes (IEC 60034-1) |
| NEMA MG 1 | Motor voltage unbalance | Derate above 1%; never operate above 5% (UCT thesis) |
| NRS 048-2:2025, clause 4.2.4.2 | Network compatibility level | 2% at LV/MV/HV; 3% permitted where single- and two-phase customers predominate (NERSA) |
Machines are type-tested in conditions cleaner than 0.5% and warranted for continuous duty at 1%. Networks are planned to 2% and tolerated at 3%. That is a gap of two to six times between the environment in which a machine was proven and the environment into which it is sold. Nobody is being dishonest. The standards simply were not written to talk to each other.
The motor is being braked, not just heated
This is the concept most often lost in translation, and it is genuinely interesting once the physics comes into focus.
Unbalanced terminal voltages resolve into two sets of balanced voltages. The positive-sequence set produces the airgap field you intended: rotating forward, doing useful work. The negative-sequence set produces a second field rotating in the opposite direction. That field does not simply add heat. It fights the shaft.
Voltage unbalance, resulting in negative sequence voltage components at the motor terminals, produces a flux in the motor air gap which opposes the direction of rotation, creating additional braking torque, potentially causing motor stalling. CIGRE US National Committee
The protection literature describes the same mechanism from the operational side: negative-sequence currents reduce the available accelerating torque, which lengthens the acceleration time and further contributes to motor overheating (IEEE Std C37.96-2000). A longer start means more seconds at high current, which means more heat, which means the thermal penalty of unbalance compounds itself at exactly the moment the machine is most vulnerable.
And the mechanical consequence is not confined to a reduction in mean torque. Because the two fields rotate in opposite directions, their interaction with the rotor produces a torque ripple at twice the fundamental frequency, superimposed on the useful shaft torque and transmitted straight into bearings, couplings, keys and driven machinery (analysis of unbalanced supply effects). A drivetrain specified for a smooth 50 Hz machine is quietly absorbing a 100 Hz alternating load nobody put in the specification. Relay manufacturers treat this as a known signature: phase unbalance and broken-phase conditions cause additional heat losses and local overheating of the rotor as well as mechanical vibrations (ABB negative-sequence protection documentation).
So when a vibration analyst finds an unexplained 100 Hz component and a maintenance team keeps replacing couplings, the root cause may not be mechanical at all. It may be sitting in the transformer tap setting or the single-phase load distribution three levels upstream.
Why the rotor takes the worst of it
Here is the detail that explains the severity. Slip with respect to the negative-sequence field is (2 − s). A machine running at 2% slip therefore presents a slip of roughly 1.98 to the reverse-rotating field. Rotor currents are induced at nearly double supply frequency (CIGRE), which is squarely in the band where skin effect raises effective rotor bar resistance — so the same current produces more heat than it would at fundamental frequency.
Worse, the machine’s negative-sequence impedance is close to its locked-rotor impedance. The motor presents a very low impedance to negative-sequence voltage and therefore drinks it greedily. This is the mechanism behind a rule of thumb every field engineer should carry: current unbalance is usually six to ten times the voltage unbalance (Power Monitors Inc.). A 3.13% voltage unbalance measured in the field produced 37% to 40% current unbalance and a derating factor of 0.88 — a 10 HP machine reduced to 8.8 HP of usable output.
At the extreme, thermal damage becomes structural. Excessive rotor heating can deform rotor bars, leading to catastrophic mechanical failure (CIGRE). The failure that arrives as a bang and a shower of laminations began as an arithmetic problem in the symmetrical components.
Heat that compounds: the square law nobody budgets for
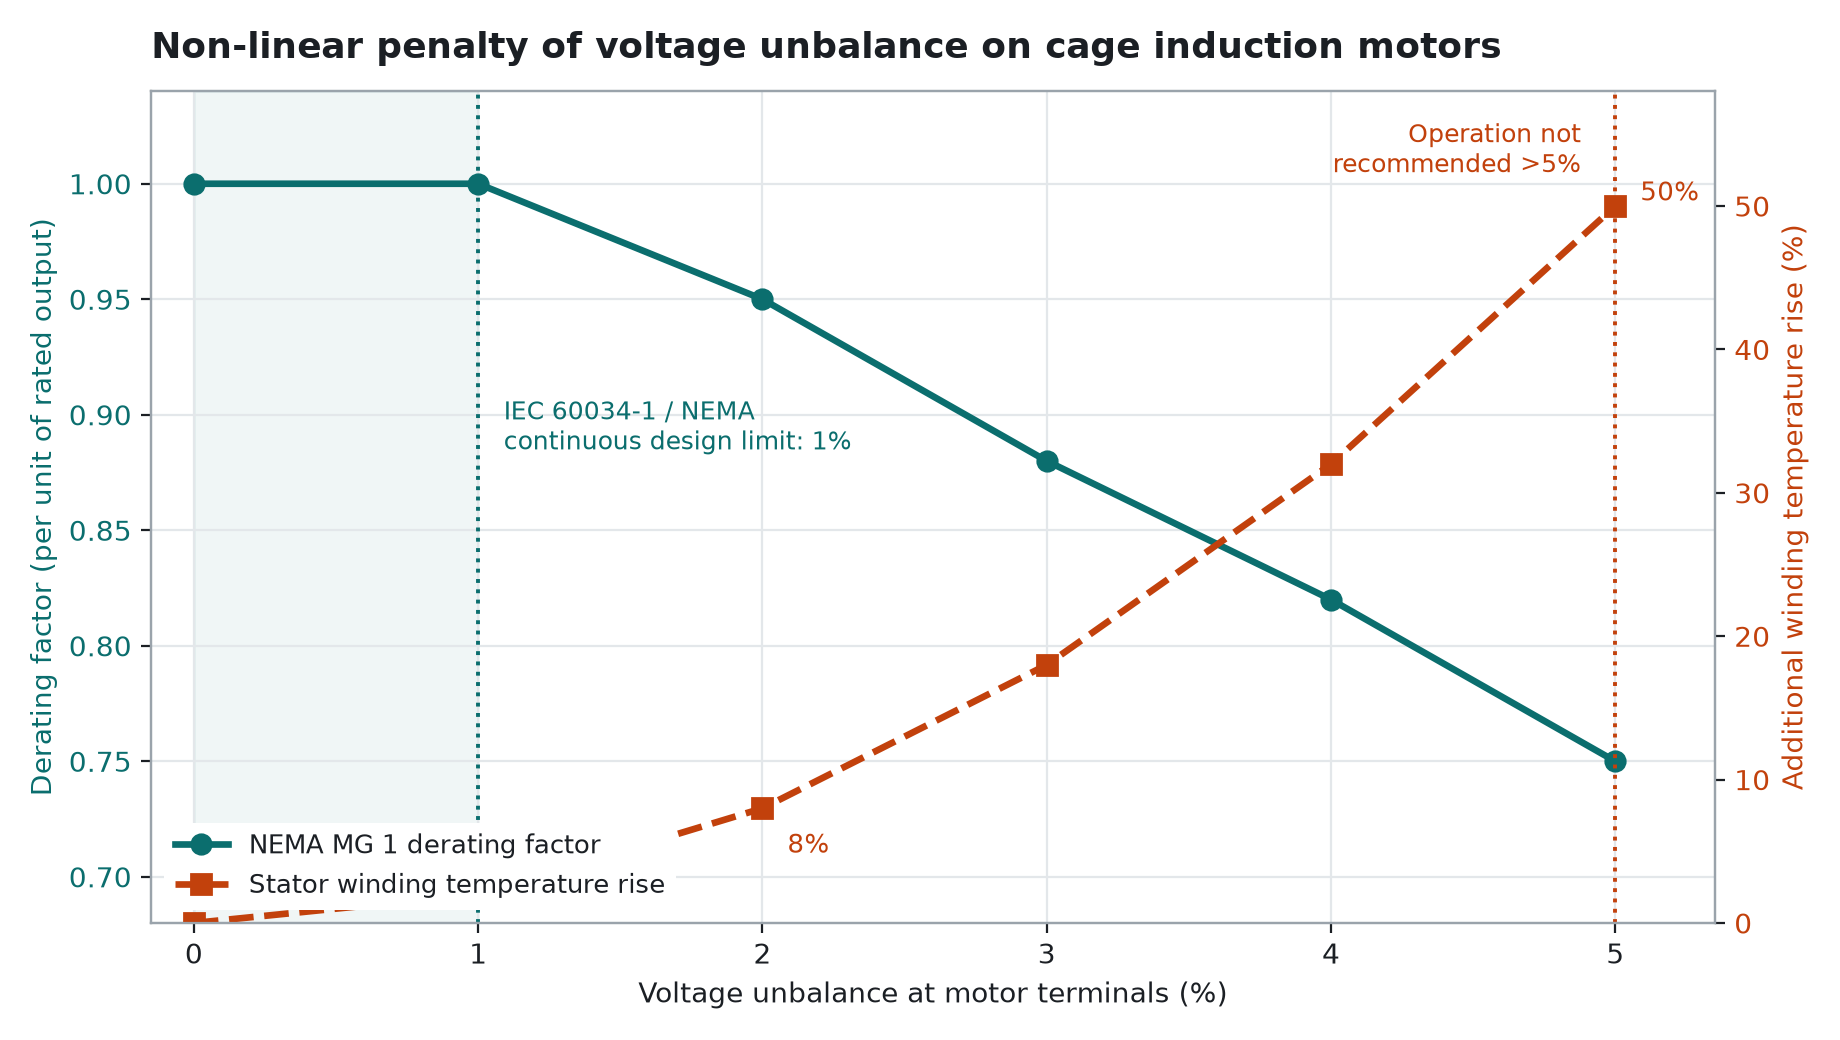
Additional stator winding temperature rise follows a square law in unbalance. The percentage rise is approximately two times the square of the percentage unbalance: 8% at 2% unbalance, 18% at 3%, 32% at 4%, and 50% at 5%. The same source pairs that arithmetic with an unambiguous verdict — unbalance above 2% is unacceptable — and with the ageing law that makes it matter: average insulation life expectancy halves with every 10 degrees of temperature rise (ABB power conditioning technical paper).
Put those two statements together and the economics change shape. The NEMA MG 1 and IEEE 141 derating curve falls from 1.00 to 0.75 as unbalance rises from 1% to 5%, with motors designed for continuous full-load operation only at 1% (Derating of Induction Motors Due to Power Quality Issues). A 25% derate sounds survivable — you oversize the motor and move on. Sizing guidance says as much: to develop 10 kW reliably at 3% unbalance, specify roughly 12 kW or a 1.15 service factor (Power Quality Australia Technote 6).
But derating protects the output. It does not undo the temperature rise on a machine that was not derated, and most installed machines were not. Those machines are not running at reduced output. They are running at rated output with an extra 18% or 32% of temperature rise, converting an expected twenty-year insulation life into something closer to ten, or five. That loss is invisible until the day the winding fails, and it does not appear on any trend log because temperature rise is not what anybody is trending.
The efficiency paradox: your best motors are your most exposed
This is the finding that should change specification practice, and it is counterintuitive enough that it deserves a section of its own.
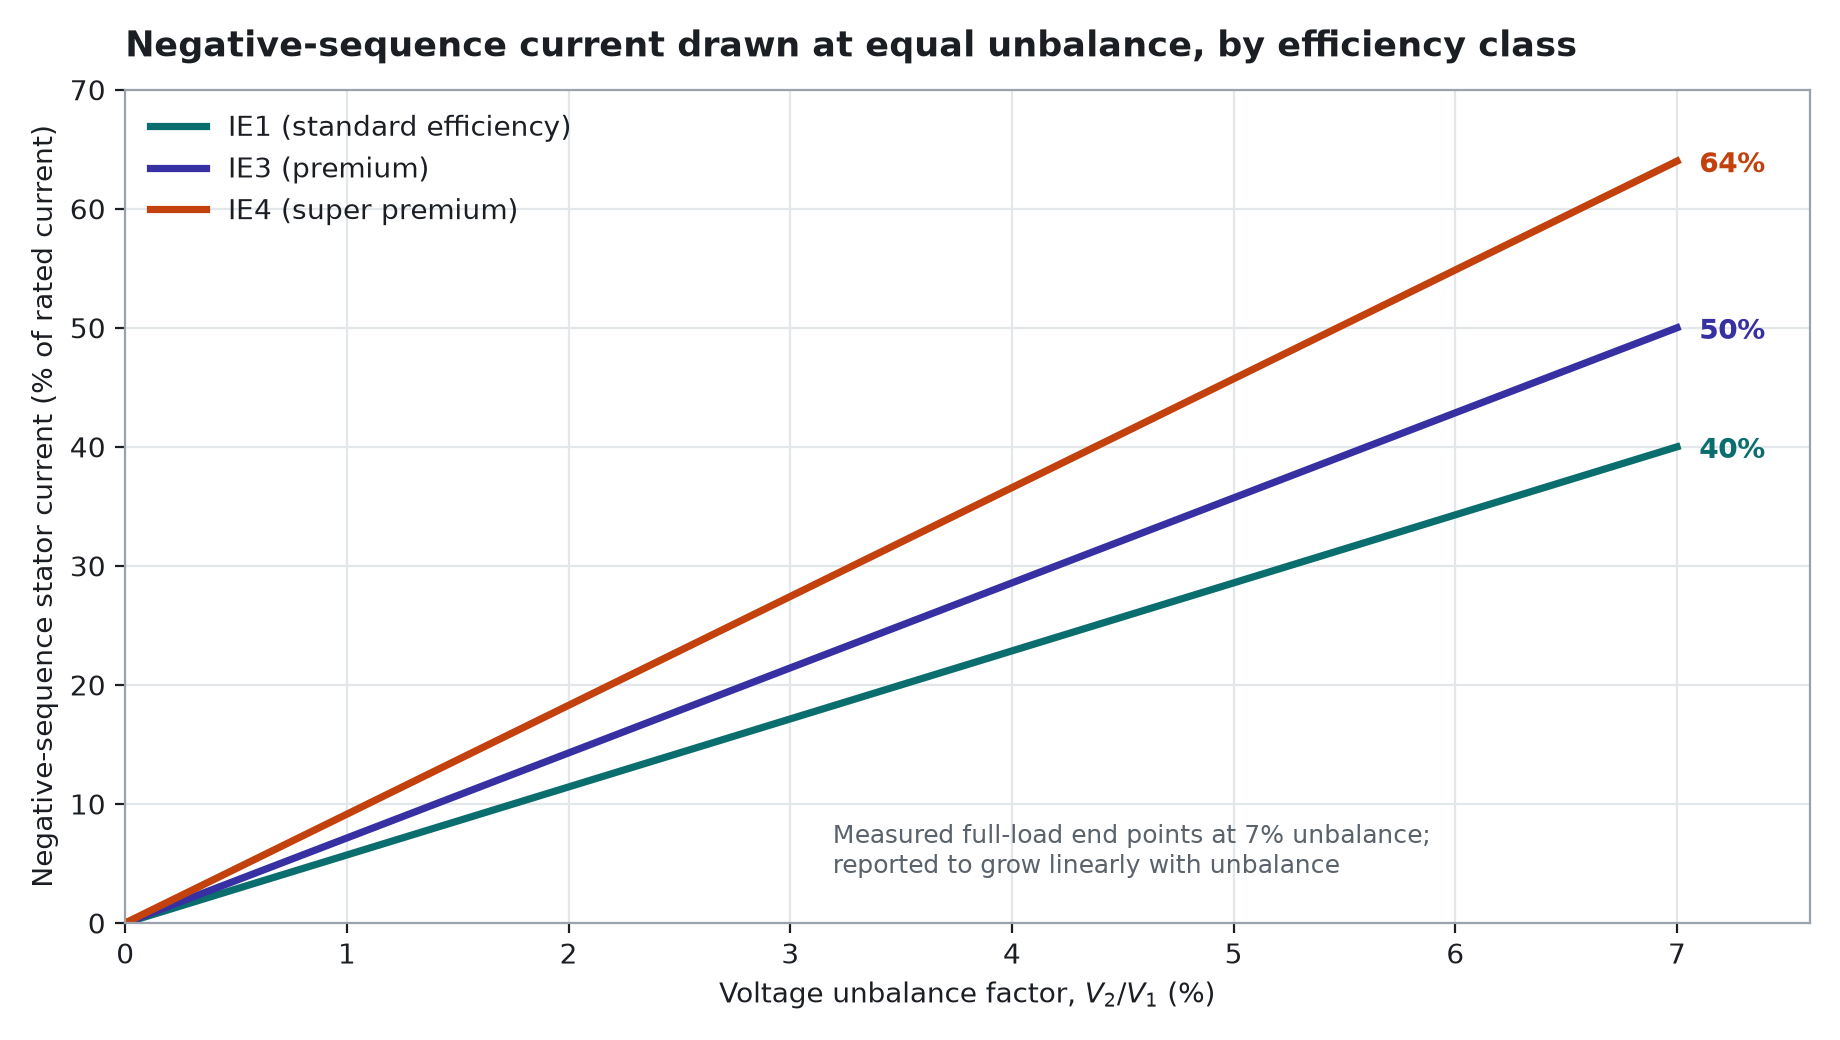
Measured negative-sequence currents at a voltage unbalance factor of 7% reach 40% of nominal current for an IE1 machine, 50% for IE3, and 64% for IE4 — corresponding to negative-sequence resistances of 2.1 Ω, 1.73 Ω and 1.26 Ω respectively. The decisive conclusion: the standard NEMA derating curve remains adequate for IE1 and IE3 machines but is insufficient for IE4 machines above a voltage unbalance factor of 3.5% (Derating of Induction Motors Due to Power Quality Issues).
The physics is almost cruelly logical. Efficiency gains come largely from reducing winding and rotor resistances. Lower resistance means lower negative-sequence impedance. Lower negative-sequence impedance means more negative-sequence current admitted for the same negative-sequence voltage. The very design choices that earn the IE4 label make the machine a better absorber of the thing that damages it.
Which produces an uncomfortable policy collision: energy-efficiency mandates and unbalance tolerance pull in opposite directions, and the derating tables embedded in the standards predate the machine population now being installed. A plant that upgrades to premium-efficiency motors to cut its energy bill, in a network sitting at 3% unbalance, may have quietly traded an operating cost for a reliability cost — and the derating table it consulted will have told it everything was fine.
There is a second trap layered on top. NEMA MG 1 Part 30 derates for harmonic content on the explicit assumption that voltage unbalance is negligible (NEMA MG 1 Part 30). The two derating mechanisms were never designed to be superimposed. Real installations experience both simultaneously, and no standard tells you how to combine them.
Converters: the rectifier that thinks it is single-phase
Rotating machines are only half the story. Three-phase diode rectifier front ends — the grid interface for variable-speed drives, servo systems, UPS units and switch-mode supplies — respond to unbalance in a completely different and arguably more insidious way.
During voltage unbalance events, three-phase diode rectifiers are forced to enter in single-phase operation mode which can generate low-order harmonic components (100 Hz, 300 Hz etc. at 50 Hz mains) in DC-link voltage. These low-order voltage harmonics significantly raise the AC-flux densities of DC-link capacitors. Aalborg University, presented at APEC
Two things follow, and both are the kind of problem that gets misdiagnosed for years.
First, the harmonic spectrum changes character rather than merely growing. A six-pulse converter is normally a source of 5th, 7th, 11th and 13th harmonics. Under unbalance, triplen line-current harmonics uncharacteristic to these rectifier systems can exist, leading to unexpected harmonic problems (Power Quality Australia Technote 6). Your six-pulse drive becomes a source of third-harmonic current that the four-wire installation downstream was never assessed for. Independent work confirms that a slightly unbalanced grid causes large current unbalance and non-characteristic harmonics in three-phase uncontrolled rectifiers (IET Power Electronics). If you have ever chased a mysterious third harmonic in an installation with no obvious single-phase load, this is a candidate.
Second, the increased ripple current flows into the DC-link capacitor bank, dissipates in the equivalent series resistance, and raises core temperature. Aluminium electrolytic capacitor life obeys the Arrhenius ten-degree rule, halving for every 10 °C rise in operating temperature (TDK, ROHM, Nippon Chemi-Con).
So a modest, chronic unbalance does not trip anything. It does not alarm. It expresses itself as a halved capacitor service interval, observed three or four years later as a population of drives failing early — failures that get attributed to the drives, the manufacturer, the ambient temperature, or the panel design. Almost never to the supply.
There is a neat irony here too. Three-phase UPS output quality is specified precisely in these terms: output imbalance is defined by negative-sequence and zero-sequence percentages (UPS design thesis, METU). The converter suffers unbalance at its input and is held contractually accountable for unbalance at its output.
IT infrastructure: €12 million, and it started in the neutral
Data centres and commercial IT loads combine two mechanisms that are individually manageable and jointly dangerous. Load unbalance across phases produces a fundamental-frequency neutral current. Separately, the triplen harmonics inherent to single-phase switch-mode supplies are zero-sequence, so they add arithmetically in the neutral instead of cancelling.
Unbalance alone is a modest neutral stressor. A purely linear unbalance of 12, 10 and 8 A yields only 3.5 A of neutral current — a neutral loading factor of 0.35 (MDPI Energies, neutral conductor loading analysis). Unbalance combined with triplen harmonics is a different animal entirely.
The documented outcome is sobering. In a 2019 Nordic data centre event, a neutral conductor failure took 40% of server capacity offline for three weeks and produced an insurance claim exceeding €12 million. The facility was 800 racks of single-phase switch-mode supplies behind a 2 500 kVA dry-type Dyn11 11 kV/400 V transformer, serving 1 600 kW of IT load and 400 kW of cooling on a 400/230 V TN-S system. The neutral carried 1.73 times the phase current. Neutrals sized equal to the phase conductors reached over 180 °C. Insulation degraded, the UPS tripped on a ground fault, PDU busbars were damaged, and connectors melted (ECAL data centre case study).
The measured harmonic spectrum from that event is worth studying closely, because it is the clearest illustration of the sequence mechanism you will find in a real installation: 80% at the 3rd, 60% at the 5th, 40% at the 7th, 20% at the 9th, 12% at the 11th, 8% at the 13th, 5% at the 15th.
Now sort those by sequence. The 3rd and 9th are zero-sequence, and they load the neutral. The 5th and 11th are negative-sequence, and they impose reverse-rotating fields on every motor sharing that busbar — including the chillers and fans of the cooling plant that keeps the servers alive. The 7th and 13th are positive-sequence. One distorted load population attacks the neutral, the transformer and the motors by three separate routes simultaneously.
And here is why it went unnoticed: a total harmonic distortion figure reports magnitude only. It cannot tell you what share of that distortion is negative-sequence and therefore aimed at your rotating plant. The number on the report was almost certainly recorded. Its meaning was not.
Cables: the quiet paths that stop being quiet
Under balanced sinusoidal conditions, the cable neutral and the metallic sheath carry effectively no current. Cable ampacity ratings are computed on exactly that assumption. Negative- and zero-sequence currents break it.
The loss increase factor relative to the balanced case can be written as one plus the square of the negative-sequence current ratio plus the square of the zero-sequence ratio weighted by the ratio of zero- to positive-sequence resistance. For a 0.38 kV overhead line with a neutral cross-section equal to the phase conductors, that resistance ratio is 4, so zero-sequence current is four times as expensive in loss terms as an equivalent negative-sequence current. Field measurements at an Irkutsk substation, part of a study spanning more than thirty years, found neutral current 21.3% above the mean phase current in winter and 26% in spring, with an average power-loss factor of 2.06 — losses more than double those of the balanced case (European Proceedings, power losses under unbalanced load).
Double the losses is not an efficiency footnote. It is a thermal input, and cable insulation is exquisitely sensitive to temperature. Cross-linked polyethylene is expected to last 40 to 60 years at its 90 °C rated operating temperature. Accelerated ageing tests to a 50% retention of elongation at break tell a much shorter story once you climb above that:
| Conductor temperature | Estimated XLPE life, material A | Estimated XLPE life, material B |
|---|---|---|
| 90 °C (rated) | 40–60 years | 40–60 years |
| 95 °C | 27.5 years | 29.7 years |
| 100 °C | 13.9 years | 14.9 years |
| 105 °C | 7.2 years | 7.6 years |
Data from an XLPE thermal ageing study. Read the pattern rather than the individual numbers: in the 95 °C to 105 °C band, a cable loses roughly half its remaining life for every additional 5 °C. Fifteen degrees above rated is not a 17% penalty. It is an 80% penalty.
At high voltage the failure mode moves to the sheath, and it becomes a self-reinforcing loop. Zero-sequence current arising from harmonics and unbalanced loading increases the sheath voltage and cable temperature, so cable faults occur at cable terminations in high-voltage underground lines (HV cable jointing and terminations review). Sheath circulating currents depend on the asymmetry of the load currents, the laying method and the length of the minor sections, and as unbalance increases, the circulating current in the cable sheath increases (Universidad Politécnica de Madrid). One monitored case recorded a sheath current peak of 60 A settling to 40 A for two hours, after which the cable experienced a joint failure (Tampere University thesis on cable sheath currents).
Then the loop closes: over-sheath faults themselves make sheath currents unbalanced (UPM doctoral thesis). Unbalance raises sheath current. Sheath current raises temperature and accelerates ageing. Ageing produces over-sheath faults. Those faults increase sheath current unbalance further. The degradation feeds itself, and no ammeter on a phase conductor will show you any of it.
Transformers: flux going where there is no iron
Transformers suffer twice under unbalance, and the second mechanism is the one that defeats conventional monitoring.
The first is conventional additional loss. Severe unbalance produces negative-sequence currents which adversely affect feeding transformers and generators through overheating and the development of hot spots, derating system capacity as a result (Kerala SERC technical filing). Since stray losses represent roughly 20% to 25% of total load losses (stray-loss analysis), any mechanism that multiplies stray loss has serious thermal leverage. Additional losses cause thermal damage in the insulation, iron core and windings (derating of asymmetric three-phase transformers).
The second mechanism has no analogue under balanced loading at all, and it is genuinely elegant in the way physics sometimes is when it is about to cost you money.
In a three-phase, three-limb core-form transformer, the three phase fluxes cancel and the resultant zero-sequence flux is null only while the phase currents are equal in magnitude and displaced by 120 degrees. Let terminal-voltage unbalance occur, and the fluxes no longer cancel. The residual flux has to go somewhere, and there is no core limb for it.
The zero-sequence flux jumps from the top yoke, passes through a huge air or oil gap, closes by cover and the tank wall, and returns to the bottom yoke… One of the dangerous consequences of the presence of zero-sequence flux is that the core, cover and tank may be heated to an unacceptable temperature due to additional stray losses. Universidade de Vigo, RNM2D_0 stray-loss analysis
Eddy-current losses are responsible for the tank heating effect and are proportional to the magnitude of the zero-sequence flux inducing them. The same work reports that the additional losses generated on the tank wall are of great magnitude, and that prolonged operation with significant zero-sequence flux can result in excessive heating of metallic structural parts external to the core.
Now consider what that means for asset management. The hot spot is on the tank wall and the cover — not in the winding. Winding hot-spot models will not find it. Fibre-optic winding sensors will not find it. Top-oil thermal models will not find it. The affected steel is structural rather than electrically active, so nothing in a routine loss measurement reveals it. The exposed configuration is a Y-Yn unit without a delta tertiary winding or magnetic shunts, which describes a very large share of the installed distribution transformer population.
The consequence is governed by the Montsinger relationship in the loading guide: insulation life halves for approximately every 6 °C to 8 °C of hot-spot rise above rated, with normal life expectancy corresponding to a hot spot of at most 98 °C (IEEE C57.91-2011 loading guide). Because the loading equations take the load factor as an equivalent balanced current, a transformer sitting well inside its measured loading limits can be losing life at several times the expected rate through sequence losses that never enter the calculation.
The oversight gap: measuring a fast phenomenon with a slow instrument
Everything above is documented, mainstream engineering. So why does it keep surprising people? Because the measurement framework we all rely on is, by construction, incapable of showing it.
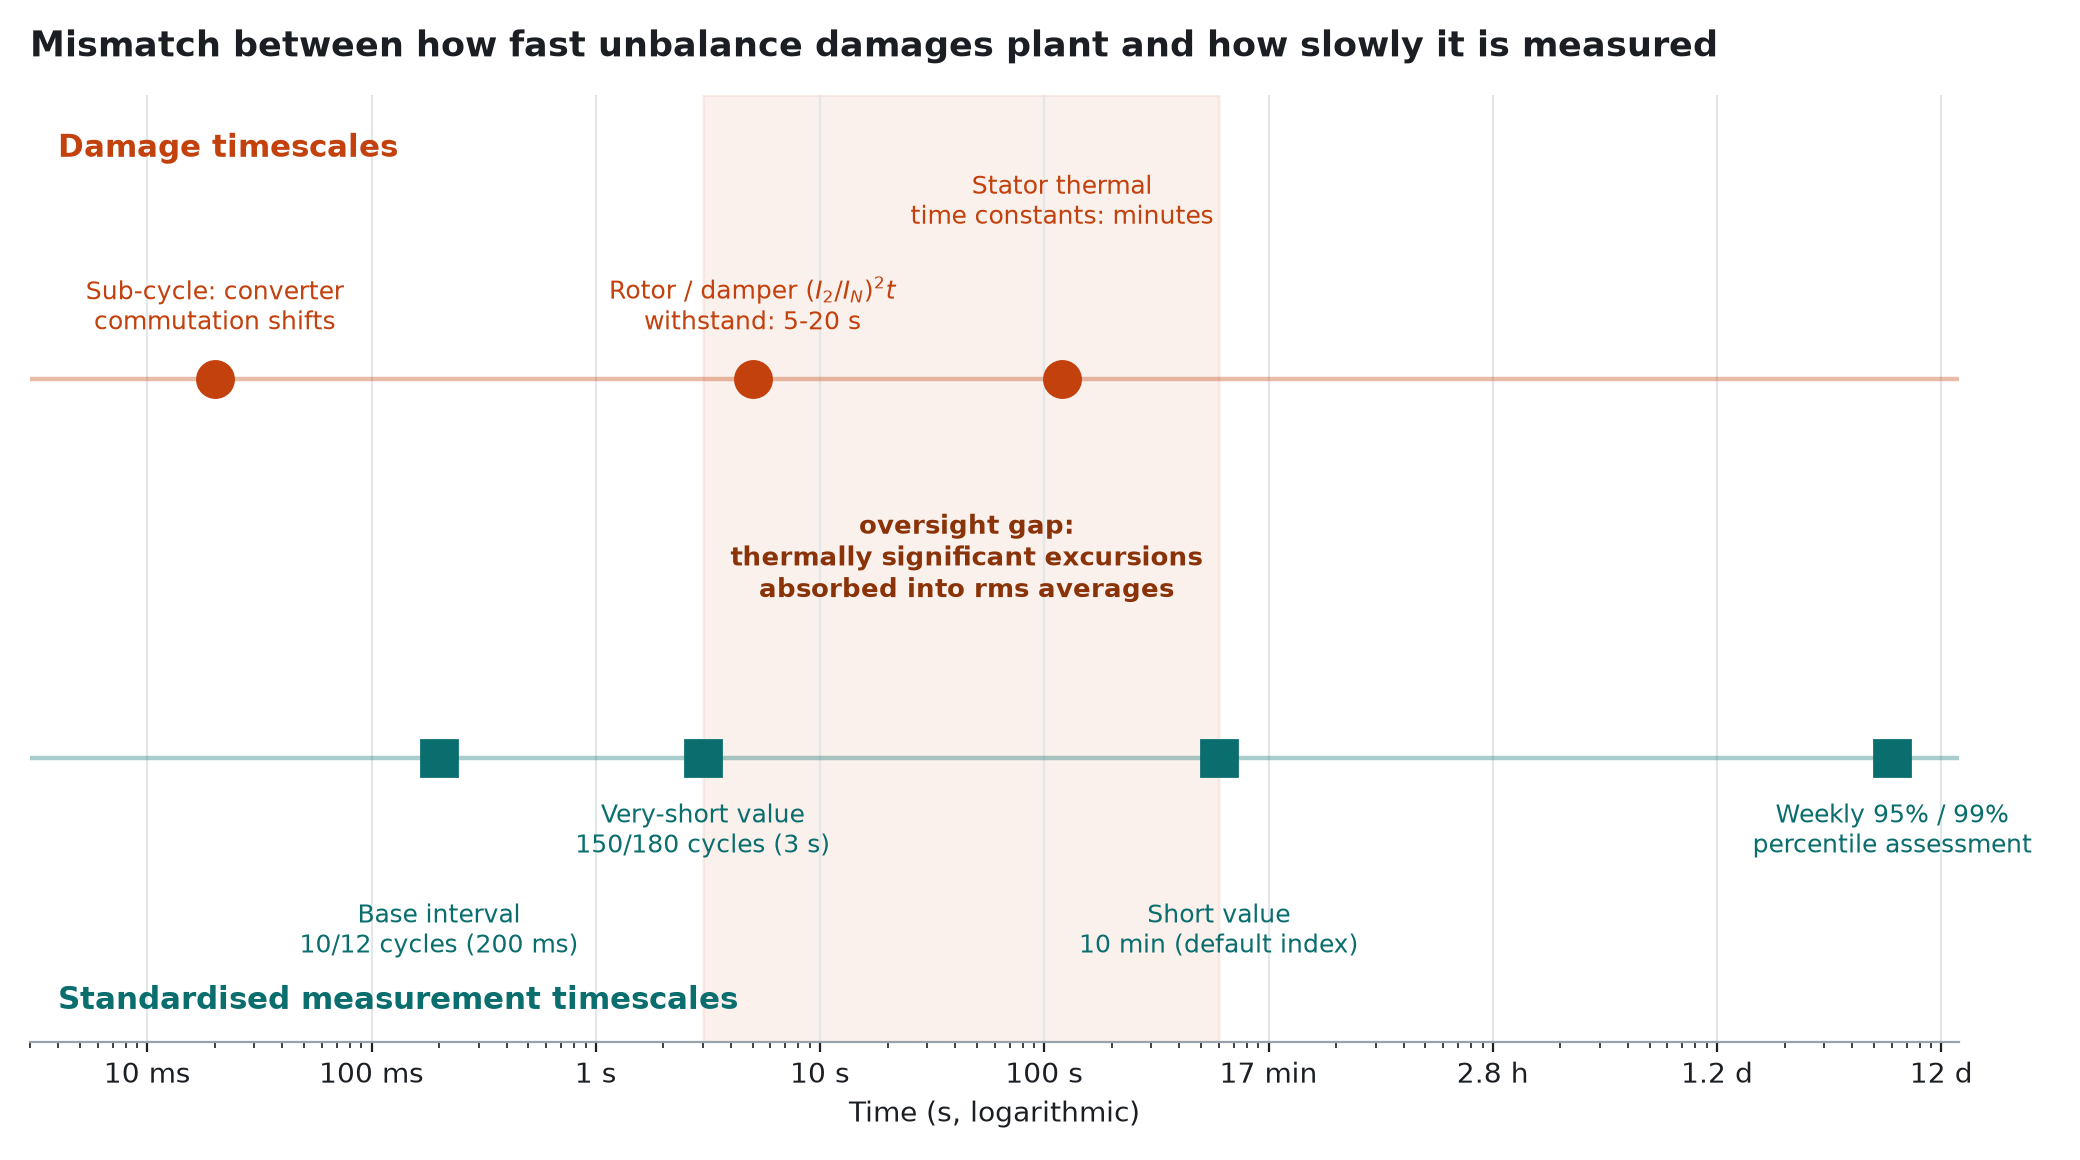
IEC 61000-4-30 Class A defines a chain of nested intervals: a base interval of 10 cycles at 50 Hz (about 200 ms), aggregated to 150 cycles (about 3 s), aggregated to 10 minutes on an absolute clock, aggregated to 2 hours (powerquality.blog on Class A). Aggregation is performed as the square root of the arithmetic mean of the squared input values (Sensors review of power quality measurement).
That last detail is the whole ballgame. A quadratic mean over an interval is precisely the operation that converts a short, high excursion into a small increment of a long, low average.
Work the arithmetic. A 30-second excursion to 6% unbalance, embedded in a 10-minute window otherwise sitting at 1.2%, aggregates to a reported value of roughly 1.9%. That is inside every compatibility level in force. Meanwhile the rotor of an affected motor has just spent 30 seconds at a stressor that IEC 60034-1 permits only for a few minutes at 1.5%. The report says compliant. The machine says otherwise, and only the machine is right.
Then the number is reduced further. Compliance is assessed as the highest 95% weekly value (NRS 048-2:2025). Five percent of the 1 008 ten-minute intervals in a week — over eight accumulated hours — may exceed the compatibility level with no compliance consequence whatsoever.
Three features that remove the evidence on purpose
It gets more pointed. Three characteristics of the framework actively discard the most damaging data.
Class S instruments may sample intermittently. A minimum of three 10-cycle values must be used every 150-cycle interval — at least one every second (Sensors review). Three of fifteen base values means up to 80% of the record can simply be absent.
Fault-coincident data is deliberately flagged out. This is the most consequential of the three:
Flagged values due to interruptions, voltage dips, voltage swells, rapid voltage changes, voltage transients and transient overvoltages should be removed from the statistics. CEER Guidelines of Good Practice on Voltage Quality Monitoring
Asymmetrical faults are the single largest cause of severe transient unbalance. Asymmetrical faults produce voltage dips. Therefore the flagging rule systematically deletes the highest-negative-sequence events from the very record used to judge unbalance performance. The rule exists for a defensible reason — you do not want dip data polluting continuous-phenomenon statistics — but the side effect is that the worst unbalance in the week never appears in the unbalance statistics. The same guidance recommends shorter intervals while conceding that most European countries use 10-minute values, which is also the default value for most monitoring equipment.
Assessment is not site-specific. The CIGRE benchmarking work states that evaluation with respect to compatibility levels should be made on a system-wide basis, and that no assessment method is provided for evaluation at a specific location (CIGRE WG C4.27). The customer whose motor just failed cannot demonstrate non-compliance at their own point of connection using the framework’s own method.
Layer on the taxonomy problem and the picture completes itself. IEEE 1159 classifies unbalance as a steady-state phenomenon (IEEE 1159 panel material). A phenomenon classified as steady-state gets instrumented, aggregated and reported as steady-state, so the rapid excursions that matter are out of scope by definition of the class. The reasoning behind that choice — that small unbalance usually does not produce immediate negative effects but rather has long-term consequences (ICEST 2019) — is perfectly sound for small unbalance and wrong for large unbalance. The trouble is that after aggregation, the instrument can no longer tell the two apart.
The comparison that makes the argument
Set the two families of timescales side by side and the mismatch is impossible to argue with.
| Aspect | Standardised assessment | Physical damage process |
|---|---|---|
| Shortest reported index | 3 seconds | Sub-cycle commutation change in rectifiers |
| Default index | 10 minutes | Rotor withstand of 5 to 20 seconds (IEC 60034-1) |
| Mathematical operator | Root-mean-square, a quadratic mean | A cumulative integral of current squared over time |
| Headline statistic | Weekly 95% value | Cumulative insulation life loss, irreversible |
| Fault-coincident data | Flagged and removed | The largest exposure in the record |
| Locus of assessment | System-wide, no site method | Site-specific plant at the end of the feeder |
Machine negative-sequence fault withstand is specified as a current-squared-time product of 5 to 20 seconds (IEC 60034-1). Rotor and damper thermal time constants sit in the same range. The framework’s shortest reported index is 3 seconds, its default is 10 minutes, and its compliance statistic is a weekly percentile. Damage integral and assessment statistic are separated by two to three orders of magnitude, and the averaging in between suppresses peaks by design.
The frustrating part is that the capability to close this gap already exists on both sides of the problem. A generalised likelihood ratio test detector achieves one-cycle detection latency and identifies 2.5% unbalance at 40 dB signal-to-noise ratio (Mitsubishi Electric Research Laboratories). Active voltage conditioners correct unbalance within 20 ms — less than one cycle (ABB). We can see it in one cycle and fix it in less than one cycle. What we lack is any requirement to report it, and therefore any commercial incentive to correct it.
EPRI names the same blind spot from the network side: one of the major gaps for continuous disturbance monitoring exists at the end of the distribution system (EPRI). Which is exactly where unbalance is largest, and exactly where the affected motors and IT loads are connected.
The South African case, and why the trend is getting worse
Working in a constrained network sharpens all of this considerably.
The South African framework tolerates 2% generally and up to 3% in rural networks (UCT thesis), with Eskom’s standard conditions of supply giving the contractual expression of that position (Eskom). But the most striking sentence in the current national standard is not a number at all:
Limits for voltage unbalance have not been specified. NRS 048-2:2025, Edition 5, clause 4.2.4.3
Compatibility levels exist. Enforceable limits do not. To be fair, the standard is technically rigorous about the physics — it is explicit that only the negative-sequence contribution is quantified, because that is the relevant component when the impact on equipment is being considered. It identifies the right stressor and then declines to bound it.
Two local factors make that gap sharper. Extensive single-phase and two-phase reticulation is precisely the condition under which the standard relaxes the compatibility level to 3%, so the networks carrying the most unbalance are permitted the most of it. And repeated load-shedding subjects motors to frequent restarts, during which negative-sequence current reduces available accelerating torque and lengthens acceleration, further contributing to overheating (IEEE Std C37.96-2000). Thermal exposure per start is elevated at exactly the moment starts become most frequent and the network is weakest. Three compounding factors, arriving together, in the same week.
Globally, the trend runs the same direction. Photovoltaic- and EV-rich LV networks already exceed unbalance limits, with a General Summation Law applied where more than ten unbalanced installations combine or where unbalance varies randomly in time (MDPI Energies). Single-phase rooftop generation, single-phase EV charging and single-phase heat pumps are all unbalance sources whose diversity cannot be relied upon. The same source notes national codes as tight as 0.7% in Croatia — an order of magnitude tighter than a 3% rural allowance, and a good indication of how wide the spread of international practice remains.
Meanwhile, immunity testing exists for equipment rated up to 16 A per phase under IEC 61000-4-27 (IEC). Which leaves the large motors, drives and transformers that suffer most sitting outside any immunity test regime at all.
What it all comes down to
Strip away the standards numbers and one structural insight remains, and it is the reason this problem persists.
Every damage mechanism examined here is driven by a squared or exponential function of a quantity that is reported as a linear time-average. Rotor heating goes as current squared times time. Stator temperature rise goes as the square of unbalance. Cable and transformer stray losses go as the square of current magnitude. Insulation life decays exponentially with temperature under the Arrhenius and Montsinger laws.
The reporting chain does the opposite. It applies a quadratic mean over 200 ms, then over 3 seconds, then over 10 minutes, then takes a weekly percentile, and then discards the fault-coincident data. Squared damage functions integrated against averaged stress measurements produce a systematic underestimate — and the magnitude of that underestimate grows with the peakiness of the disturbance. Which is to say: the worse a network’s unbalance behaviour actually is, the more the measurement framework flatters it.
If you own or operate plant in a network sitting anywhere near its compatibility level, a few things are worth doing before the next failure rather than after it. Instrument sequence components rather than deviation ratios. Set negative-sequence overcurrent protection with an inverse-time characteristic matched to the machine’s own current-squared-time constant, so the relay integrates damage rather than averaging stress. Re-examine derating for IE4 machines, where the standard curve is documented as insufficient above 3.5%. Size neutrals in IT installations on measured triplen content, not fundamental unbalance. And take a thermal camera to the tank wall and cover of your Y-Yn transformers, because that is where the flux goes when there is no iron to carry it, and no winding sensor will ever tell you it went there.
Here is the thought worth sitting with. We can detect voltage unbalance in one cycle. We can correct it in less than one cycle. Every mechanism described above is documented in standards that engineers cite every week. And yet the compliance framework built on top of all that knowledge reports a weekly percentile of ten-minute averages, with the worst events deleted, and calls a network compliant.
So the question is not whether we understand voltage unbalance. We clearly do. The question is this: if the physics has been settled for decades and the technology to see and fix it already sits on the shelf, what exactly are we waiting for — and who is paying for the delay in the meantime?
Right now, the answer to the second half of that question is uncomfortably clear. The cost of unbalance is being paid, quietly and continuously, by the rotor bars, the DC-link capacitors, the neutral conductors, the cable joints and the transformer tank walls of the connected customer. It is being paid on a schedule nobody is measuring, against a standard that has declined to set a limit.
Primary sources referenced throughout include IEC 60034-1:2017, IEC 61000-4-30, IEC TR 61000-3-13:2008, IEEE Std C37.96-2000, IEEE Std 1159-2009, IEEE C57.91-2011, NEMA MG 1 Part 30, NRS 048-2:2025 (NERSA), the CEER Guidelines of Good Practice on Voltage Quality Monitoring, and CIGRE Working Group C4.27, alongside peer-reviewed measurement studies and documented field failures.
