
Consulting Services, Power Quality Consulting, Power Quality Matters, Power Quality Monitoring
The 10-Minute Power Quality Illusion
Sep
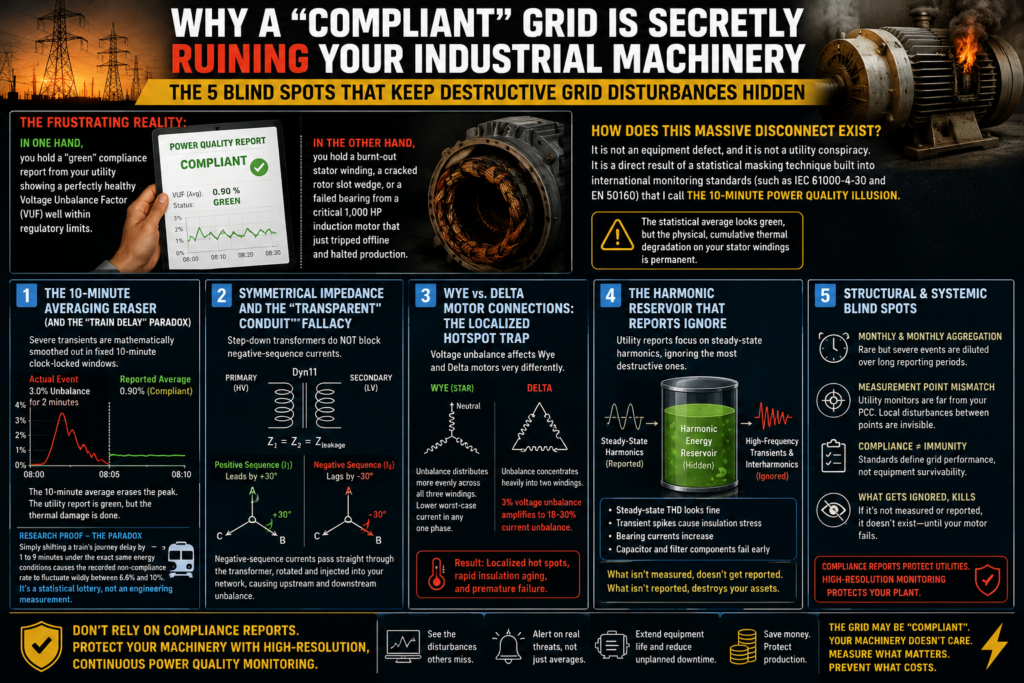
Why a “Compliant” Grid is Quietly Melting Your Plant’s Motors
Imagine this scenario: you are a plant manager or systems engineer standing on a noisy, vibrating factory floor next to a critical 1,000 HP induction motor that has just tripped off-line due to a winding insulation failure. You check the utility’s monthly Quality of Supply (QOS) compliance logs, and everything is completely “green”. According to the utility’s reports, the voltage unbalance factor (VUF) is well within the regulatory limits.
You are left with a burnt-out stator winding, a six-figure repair bill, and a massive paradox. How can a power grid be 100% compliant on paper while physically destroying your rotating machinery and electrical assets?
The answer lies in a combination of temporal low-pass filtering, utility impedance masking, and the harsh laws of electromagnetic induction. Here is a technical deep-dive into why you cannot treat basic utility compliance data as a shield to protect your plant.
1. Symmetrical Components: The Mathematical “Symmetry Error Signal”
To understand why unbalance behaves so destructively, we must look to the mathematical framework established by Charles Fortescue in 1918. Symmetrical component theory allows any arbitrary, unbalanced set of three-phase vectors (currents or voltages) to be decomposed into three decoupled, balanced vector sets:
- Positive Sequence (I1, V1): Three phasors of equal magnitude, displaced by 120°, rotating in the normal system direction (A → B → C). This represents the normal, balanced state that carries useful active power transfer.
- Negative Sequence (I2, V2): Three phasors of equal magnitude and 120° spacing, but rotating in the reverse phase order (A → C → B) at the same system frequency.
- Zero Sequence (I0, V0): Three in-phase phasors (0° angular displacement) that represent common-mode quantities. These require a physical neutral or ground path to flow.
Under perfectly balanced conditions, negative-sequence and zero-sequence components vanish. In real-world systems, single-phase loads, untransposed transmission lines, and asymmetrical impedances introduce unbalance. Negative-sequence components serve as a direct measure of unbalance—essentially a “symmetry error signal”.
2. The 10-Minute Averaging Illusion (Temporal Low-Pass Filtering)
The core standard governing utility power quality monitoring globally—IEC 61000-4-30 (Class A)—defines the measurement and aggregation methods that utilities must report to regulators. It specifies that continuous high-speed cycle data must be aggregated into fixed 10-minute clock-locked windows.
While a 10-minute window is statistically convenient for utilities, it acts as a severe mathematical low-pass filter that completely smooths out rapid, highly intermittent load variations.
If a severe unbalance or harmonic surge occurs intermittently (for example, during train acceleration on high-speed rail lines or the melt cycle of an industrial arc furnace), the peak value is mathematically diluted over the rest of the 10-minute block:
Where Aagg is the aggregated value reported by the meter, Ad is the magnitude of the parameter during the disturbance, d is the duration of the disturbance, T is the 10-minute window (600 seconds), and Abase is the quiet baseline.
If a highly destructive unbalance spike (Ad = 10%) occurs for 2 minutes (d = 120 seconds) while the system is quiet (Abase = 2%) for the remaining 8 minutes, the reported 10-minute average is only 3.6%. This value is mathematically smoothed down.
Furthermore, because these 10-minute aggregation windows are rigidly locked to absolute clock boundaries (e.g., 08:00 to 08:10), a transient event can easily be split across consecutive windows. If an intense unbalance event overlaps a window boundary, the reported value is fragmented even further. Real-world testing reveals that under identical load conditions, a simple shift in the start of the measurement window can fluctuate the reported non-compliance rate between 6.6% and 10%. The utility’s weekly 95th percentile compliance reporting acts as a statistical eraser, keeping physical damage invisible.
3. The Impedance Masking Fallacy: Why Utilities Are Blind to Downstream Propagation
Even if a utility registers a clean voltage profile, the currents propagating through the system tell a different story. Negative-sequence voltage drops (V2) at any given bus are governed by the relationship:
Where I2 is the injected negative-sequence current and Z2 is the negative-sequence system impedance of the network.
The critical factor is grid strength (short-circuit capacity, Ssc) at the Point of Common Coupling (PCC).
- At the Utility Substation (Strong Grid): The primary substation is a heavy transmission node with low system impedance (Z2). Because Z2 is extremely low, the utility can absorb massive negative-sequence current injections (I2) from unbalanced loads while displaying a negligible voltage unbalance factor (V2 ≈ 0).
- At the Customer Substation (Weak Grid): As you move down the distribution line into the customer’s substation, the system impedance (Z2) increases significantly. The very same negative-sequence current that appeared harmless at the utility bus now generates a severe, high-magnitude voltage unbalance (V2) on your plant’s weaker bus.
Because standard utility monitoring typically only tracks voltage unbalance (V2) and treats sequence current monitoring as entirely optional, this entire current-driven propagation remains hidden until it reaches your assets.
4. The Physics of Rotor Destruction: Why Motors Hate Negative Sequence
Three-phase induction motors are incredibly sensitive to negative-sequence voltages because they lack electromagnetic symmetry under unbalance. The opposing positive and negative fields inside the machine create a highly destructive set of physical stresses:
A. The Slip Relationship and Twice-System-Frequency Heating
Under normal operation, the rotor spins at a forward speed close to synchronous speed (ns), with a small positive-sequence slip (s ≈ 1% – 5%).
However, the reverse-rotating air gap magnetic field produced by the negative-sequence current rotates in the opposite direction (-ns). The relative speed between the forward-spinning rotor and this reverse air gap field is approximately twice the synchronous speed:
This reverse field cuts the rotor surface at twice the nominal system frequency—inducing currents at 100 Hz in 50 Hz systems and 120 Hz in 60 Hz systems directly into the rotor body, slot wedges, field windings, and damper bars.
B. Skin-Effect Compression and the 5x Resistance Multiplier
Because these induced currents flow at double-frequency (100/120 Hz), they are subject to a severe skin effect. Rather than distributing evenly through the rotor conductor cross-section, the eddy currents are compressed into a highly restricted, thin depth near the rotor surface.
This current compression increases the effective AC resistance of the rotor path to approximately 5 times the normal positive-sequence resistance (Rrotor,2 ≈ 5Rrotor,1). This massive resistance increase causes rapid I2R heating to concentrate directly in damper bars, rotor slot wedges, and retaining rings, risking structural failure under centrifugal forces.
C. The 6-to-10x Current Amplification Loop
Because an induction motor exhibits very low negative-sequence impedance (approximately equal to its locked-rotor reactance), a small voltage unbalance generates a disproportionately large negative-sequence current.
The resulting current unbalance is amplified to 6 to 10 times the magnitude of the voltage unbalance:
A seemingly compliant utility voltage unbalance of 3% (the target for utility systems under ANSI C84.1) propagates into your motor as an 18% to 30% current unbalance.
This unbalance generates massive thermal losses that scale with the square of the unbalance current:
An 18% current unbalance creates 32% more heat loss inside your motor windings, raising operating temperatures by 30°C to 40°C. According to Arrhenius degradation kinetics, winding insulation life halves for every 10°C continuous temperature rise. A 3% voltage unbalance can therefore reduce your motor’s operational lifespan by up to 75%.
5. Front-End Distortion: The Variable Frequency Drive (VFD) Connection
Even if you run your motors through Variable Frequency Drives (VFDs) or Adjustable Speed Drives (ASDs) to bypass direct-on-line grid connections, voltage unbalance still introduces serious power electronic degradations.
Most three-phase VFDs utilize a standard 6-pulse diode rectifier bridge on their front-end to charge a common DC-link capacitor. Under balanced supply conditions, the diodes conduct in pairs, drawing a double-pulse current waveform that generates standard characteristic odd harmonics (5th, 7th, 11th, etc.).
However, the moment a negative-sequence voltage unbalance is introduced, the peak voltage differences between phases alter the diode conduction angles.
- Asymmetric Diode Conduction: The input current morphs from a standard double-pulse waveform into a highly distorted, single-pulse waveform. This concentrates thermal stresses onto specific diodes in the rectifier bridge, leading to premature diode failures and the nuisance tripping of phase overload-protection circuits.
- Uncharacteristic Triplen Harmonics: Under unbalanced voltages, the input currents begin injecting severe uncharacteristic triplen harmonics (specifically the 3rd and 9th harmonics) into your system. While a balanced VFD generates practically no 3rd harmonic current, a 3.75% voltage unbalance causes the 3rd harmonic to skyrocket to 83.7% of the fundamental current.
- DC-Link Ripples and Capacitor Lifespan: This unbalanced conduction forces large 120 Hz voltage ripples across the DC-link capacitor, drastically decreasing its operational lifespan.
6. Symmetrical Harmonics: The Harmonic Sequence Map
In non-sinusoidal, harmonics-polluted environments (such as plants operating large numbers of VFDs, rectifiers, or single-phase switch-mode power supplies), each integer harmonic order (h) maps directly to a specific sequence component:
| Harmonic Order | Sequence Network | Mathematical Vector Behavior | Physical Grid Effects |
|---|---|---|---|
| Fundamental & 3k+1 (1st, 7th, 13th) | Positive Sequence (+1) | Normal phase rotation (A → B → C) | Contributes to normal motoring torque and system active power transfer. |
| 3k+2 (5th, 11th, 17th) | Negative Sequence (-1) | Reverse phase rotation (A → C → B) | Generates counter-rotating torque, braking effects, and rotor surface heating. |
| 3k (Triplen Harmonics) (3rd, 9th, 15th) | Zero Sequence (0) | Co-phasal (in-phase, 0° displacement) | Circulates in transformer delta windings; causes neutral conductor overloading and transformer hot spots. |
7. Strategic Recommendations for Plant Operations
To ensure your facility is truly protected from poor power quality, you must move beyond the utility’s high-level statistical compliance metrics. Plant managers should implement a proactive, multi-layered defensive strategy:
A. Install High-Resolution, Event-Based PQ Monitoring
Stop relying on the utility’s monthly 10-minute average reports. Deploy continuous, high-speed Class A power quality analyzers on your side of the PCC. Set your instruments to track unbalance over 200 ms (10/12-cycle) and 60-second aggregation windows to capture the true, unmitigated physical peaks before they are mathematically diluted.
B. Deploy Dedicated Negative-Sequence Relay Protection
Ensure your critical motors and generators are equipped with modern numerical protection relays that actively run ANSI 46 (Negative-Sequence Overcurrent) and ANSI 47 (Negative-Sequence Voltage) protection.
- Configure the ANSI 46 unbalance alarm at a low, conservative pickup threshold of 4% to 6% of the machine’s rated current with a definite-time delay of 5 to 10 seconds. This alerts operators to minor loading imbalances before any thermal damage accumulates.
- Coordinate the ANSI 46 inverse-time trip (51Q) with the machine’s specific rotor heating limit constant (I22t = K):
This ensures the relay trips the breaker before the rotor damper bars or slot wedges reach their thermal limits.
C. Implement Sequence-Weighted Thermal Models (ANSI 49)
For complete motor thermal protection, utilize the ANSI 49 Thermal Overload function, which combines positive and negative sequence currents into an equivalent heating current (Ieq):
Ensure the unbalance weighting factor (β) is set between 3 and 6 to reflect the high AC resistance of the rotor paths caused by the double-frequency skin effect.
D. Active Symmetrization (Steinmetz Symmetrization)
If your facility is forced to draw highly unbalanced phase currents or operate next to highly fluctuating single-phase loads (such as railway traction lines or massive single-phase data centers), implement dynamic shunt compensation using Static Var Compensators (SVCs) or STATCOMs at your PCC.
By dynamically adjusting individual phase susceptances based on the Steinmetz Symmetrization Principle, these systems inject compensating negative-sequence currents that are exactly equal in magnitude and 180° out of phase with the unbalance, neutralizing it before it can propagate into your rotating assets.
Summary: Protecting Your Operations
| Problem Source | Utility’s Compliant Data | The Physical Reality on Your Floor | Defensive Mitigation |
|---|---|---|---|
| Averaging Window | 10-minute average averages out transient spikes. | Continuous peaks cause rapid, localized rotor heating. | 200 ms / 60-second PQ logging to capture true transient unbalance. |
| Sequence Monitoring | Voltage-only monitoring (ignores current sequences). | Sequence current propagation amplifies unbalance downstream. | ANSI 46 current protection set to alarm at 4%–6% unbalance. |
| Grid Impedance | Strong utility bus masks unbalance voltage (V2 = –I2Z2). | Weak customer bus amplifies the voltage unbalance factor. | ANSI 47 overvoltage relays set to alarm at 3% negative-sequence voltage. |
| Asset Impact | Mathematically ignored by weekly 95th percentile limits. | Insulation life is halved for every 10°C temperature rise. | ANSI 49 thermal replicas with sequence weighting (β = 3 – 6). |
Ultimately, a power utility’s obligation is to meet high-level statistical guidelines designed to minimize network costs across a regional grid. Your obligation is to protect your facility, your rotating assets, and your bottom line. Moving beyond the 10-minute compliance illusion is the first step toward true power system reliability.
