Agulhas Utilities Corporation · Municipal accountability
Beyond Election Promises
A Municipal Lifecycle Asset Management Performance Compact
for funded services and accountable delivery.
Electricity · Water · Roads · Parks · Sewerage · Refuse
A promise is a starting point—not proof of delivery.
This proposed compact connects what residents expect with
the infrastructure work, funding, responsibilities and
evidence needed to make municipal commitments accountable.
01 · Beyond the pledge
Promises need a delivery plan
A promise to fix a pothole is easy to make. A commitment to
keep a road safe—and explain how the work will be prioritised,
funded and verified—is a different proposition.
The same test applies to electricity, water, parks, sewerage
and refuse collection. Residents should ask more than
“What will you deliver?” They should ask:
“What service level are you committing to, what will it cost,
who will be responsible, and how will we know whether you
have delivered?”
That is the case for a Municipal Lifecycle Asset Management
Performance Compact: a proposed framework connecting
community expectations to infrastructure plans, credible
funding, measurable outcomes and public scrutiny.
A proposal—not a guarantee
The compact is an original accountability proposal.
It is not presented as an internationally prescribed
instrument, an ISO certification requirement or a legally
enforceable agreement created by signature alone.
Its purpose is to strengthen the connection between municipal
commitments and the instruments through which they are
planned, funded, implemented and assessed—not to replace
those instruments.
02 · Start with residents
Purpose and vision must describe meaningful outcomes
A municipality’s purpose should explain whom it serves and
why its services matter. Its vision should describe the
future residents can reasonably expect: dependable services,
equitable access, safe public facilities and infrastructure
that can be sustained over time.
The proposed compact would translate those aspirations into
service-specific commitments. “Reliable water” would require
defined continuity and quality measures. “Better roads”
would require an identified network, condition assessments
and repair priorities. “Clean neighbourhoods” would require
defined collection coverage and schedules.
The Municipal Systems Act provides for community involvement
in municipal planning and service decisions. Its provisions
also connect financially sustainable services with the
resources needed for their provision and upkeep.
Agulhas’s article on strategic management, KPIs and budgeting
provides the conceptual foundation: connect purpose and
vision to strategic analysis, objectives, performance
indicators and resource allocation.
Community expectations→Purpose and vision→Strategic foundation→Service levels→Lifecycle interventions→Funding→KPIs→Public reporting→Corrective action
Under this proposal, municipality-wide results would be
accompanied by neighbourhood, service-zone or facility
results where practicable. Residents without adequate access
should remain visible alongside those receiving an
unreliable existing service.
03 · Know what delivery requires
Build the foundation before setting the promise
The proposed compact would require a municipality to
explain what it knows about its infrastructure, what it
does not know and what resources it needs to deliver the
agreed service levels.
01 / SERVICE LEVELS
Define the service
Specify the quality, availability and accessibility
residents should receive, including service boundaries
and exclusions.
02 / ASSET INFORMATION
Know the infrastructure
Identify the assets, their location, ownership,
operational responsibility and the confidence
of the records.
03 / CONDITION AND RISK
Understand failure
Assess condition, service performance, criticality
and the consequences of failure before assigning
intervention priorities.
04 / LIFECYCLE PLANS
Plan beyond construction
Connect operation, maintenance, rehabilitation,
renewal, upgrading and eventual disposal to
the intended service outcomes.
05 / COMPETENCE
Resource implementation
Identify the staff, contractors, equipment,
spares and management capability required
to carry out the work.
06 / FUNDING
Cost the commitment
Show the provision for current delivery and
future interventions, distinguishing secured
funding from anticipated funding.
ISO’s asset-management guidance informs this approach through
its emphasis on organisational objectives, decision-making,
risk, information and lifecycle management.
Documented international practice also offers useful
components. Wellington City Council’s long-term planning
connects infrastructure, asset-management and financial
strategies, while disclosing data limitations, affordability
constraints and renewal risks. The proposal adapts those
planning and disclosure practices—not Wellington’s
numerical funding choices.
Unknown is not the same as satisfactory
Missing condition information or incomplete records should
trigger a defined assessment programme. Uncertainty should
be disclosed—not converted into a reassuring baseline.
04 · The proposed instrument
A compact residents can scrutinise
The compact should be a concise public statement supported
by technical schedules and a costed implementation programme.
Each commitment should connect a resident-facing outcome
with the work, resources, responsibility and evidence needed
to achieve it.
Illustrative Municipal Lifecycle Asset Management
Performance Compact
Component
Commitment to record
Public evidence
Scope and boundaries
Identify services, assets, areas, owners,
operators and external dependencies.
Service maps and a responsibility schedule.
Community commitments
Define service levels, access priorities
and implementation dates.
Consultation record and planning references.
Baseline and data quality
Record starting performance, assessment coverage,
missing data and confidence limitations.
Baseline report and data-improvement plan.
Risk-based interventions
Prioritise maintenance and renewal by safety,
health, condition and service consequences.
Risk register and intervention programme.
Costs and funding
Cost capital works, operations, maintenance,
renewal and competence requirements.
Budget references, funding assumptions
and disclosed gaps.
Responsibilities
Name political oversight office-bearers
and administrative delivery owners.
Approved responsibility and delegation schedule.
KPIs and targets
Specify definitions, units, boundaries,
baselines and justified target-setting methods.
Indicator dictionary and target explanation.
Reporting and verification
Set publication arrangements and
appropriate assurance procedures.
Dashboard, source records and verification reports.
Corrective action
Define breach triggers, safeguards,
recovery deadlines and escalation routes.
Corrective-action register and closure evidence.
Review and amendment
Review alongside planning and budgeting;
explain changes publicly.
Version history and authorised amendments.
Use existing instruments—not a parallel system
The compact should be implemented through the Integrated
Development Plan (IDP), asset-management plans, municipal
budget, Service Delivery and Budget Implementation Plan
(SDBIP), departmental plans and applicable performance
agreements.
The Municipal Systems Act and Municipal Finance Management
Act establish the relevant planning, budgeting,
performance-management and oversight framework.
Treasury’s Circular 88 guidance distinguishes medium-term
outcomes from implementation and operational measures.
Four commitments that must not be confused
Candidate endorsement: a political undertaking to
support the proposal and pursue lawful implementation.
Council adoption: a formal municipal decision,
subject to powers, procedures and approved resources.
Administrative performance obligations: responsibilities
arising through applicable law, approved plans,
delegations, employment arrangements and contracts.
Legal enforceability: determined by the relevant law
and instrument—not the word “compact” or a signature alone.
The legal effect of an adopted instrument requires
municipality-specific legal assessment.
05 · Measure what residents experience
Service indicators with clear boundaries
The following indicators are proposed starting points,
not universal benchmarks or a prescribed regulatory table.
Applicable regulatory and Treasury definitions should
take precedence where relevant.
Each indicator needs a verified baseline using the same
boundary and calculation method. Its technical schedule
should name the accountable service head, data custodian
and verification method.
On smaller screens, scroll horizontally to read the full table.
Illustrative KPI framework: definitions and targets
to be finalised locally
Service-point register, schedules,
route records and missed-collection logs.
Monthly.
Adopted schedule, baseline, fleet
capacity and funded operating plan.
Solid waste: verified destination
Collected waste with reconciled receipt
at an authorised destination ÷
collected waste measured; percentage.
Weighbridge records, transport logs,
receipts and destination authorisations.
Monthly.
Applicable authorisations and
verified mass balance.
Show the cause—not only the total
The proposal would report municipal electricity-network
failures separately from upstream outages and load-shedding,
while also showing residents’ total interruption burden.
Equivalent cause separation should apply to water supply.
Technical schedules should define municipal road boundaries,
public sewer boundaries, included waste streams and included
parks. Exclusions and unmeasured populations should be visible.
Do not confuse activity with outcome
Completed work orders and expenditure would be reported
alongside service outcomes—not treated as proof of them.
No universal 85% overall equipment effectiveness
target is proposed.
Verification should include checks appropriate to each
measure: outage-record recalculation, laboratory-result
reconciliation, sampled condition surveys, site inspections
and collection-to-destination record checks.
06 · Make the evidence visible
Reporting must lead to corrective action
Political oversight and operational delivery must remain
distinct. Council oversight should not be confused with
the technical and administrative responsibilities of
the municipal manager and service officials.
The Municipal Finance Management Act assigns budget,
monitoring and accounting-officer responsibilities.
The Municipal Systems Act and MFMA also provide relevant
performance-audit and internal-assurance arrangements.
The proposed compact would publish actual results against
targets, expenditure, data limitations, reasons for shortfall
and recovery actions. Additional independent technical
checks should have a defined scope and disclosed limitations.
Each missed commitment should trigger a recorded action
with an owner, deadline, resources and closure evidence.
Persistent failures should follow authorised escalation
routes rather than remain indefinitely on a dashboard.
07 · Questions worth asking
Six questions before supporting a candidate
What service levels will you support, and how will
residents—including underserved communities—shape them?
What verified baseline supports your promises,
and which asset-condition or data gaps require assessment?
Which maintenance and renewal interventions come first,
and what risk assessment justifies that order?
What will implementation cost over the asset lifecycle,
and which funding is secured rather than merely anticipated?
How will commitments enter the IDP, budget, SDBIP and
administrative performance arrangements without confusing
political oversight with operations?
What evidence will residents receive, who will verify it,
and what happens when delivery falls short?
08 · From endorsement to delivery
Make each commitment traceable
The first test of the compact is not how many candidates
sign it. It is whether an incoming council can translate
commitments into a credible programme of work supported
by resources and evidence.
Start with a public baseline
Publish current performance, principal infrastructure risks,
available resources and information gaps. Distinguish
verified records from estimates and unknowns.
Disclose the trade-offs
Explain what will proceed, what will be deferred and what
risks remain. Expansion commitments should also identify
the proposed resources for operating and maintaining
the additional infrastructure.
Connect the documents
Give each commitment a reference linking its intended
outcome, intervention, budget provision, responsible
official and performance measure. Residents should be
able to follow that chain without navigating
disconnected explanations.
Preserve the record when plans change
Amendments should retain the original commitment,
disclose the reasons for change and explain the
consequences for residents. Targets should not be
quietly lowered to create the appearance of success.
The resident’s test
Before you vote, ask for the delivery plan
Do not settle for a promise of better services.
Ask candidates to explain the service levels they will
support, the work required, how it will be funded and
how residents will verify progress.
Use the six questions at public meetings, in written
enquiries and when assessing campaign commitments.
Ask candidates to endorse the proposed compact—and explain
how they would pursue its adoption through legitimate
municipal processes.
After the election, compare commitments with approved
plans, published results and corrective actions.
Where delivery falls short, seek an explanation,
a responsible official and a credible recovery deadline.
Vote with expectations. Follow through with questions.
Judge delivery by evidence.
Strategic Management, KPIs and Budgeting for Modern Electricity Utilities
Electricity utilities operate at the intersection of public service, capital-intensive infrastructure,
regulatory accountability and rapidly changing technology. Effective strategic management converts that
complexity into a disciplined operating system: a clear mandate, measurable outcomes, risk-based asset
decisions and budgets that allocate scarce capital where it delivers the greatest value.
The central management question is not simply, “What should the utility spend?” It is:
“What combination of expenditure, capability and risk control will deliver reliable, affordable,
safe and sustainable electricity over the full life cycle of the network?”
1. Why Strategic Management Matters in Electricity Utilities
An electricity utility cannot be managed successfully through annual budgets alone. Its performance is
determined by decisions made years earlier: network architecture, maintenance philosophy, asset replacement
timing, skills development, technology standards, customer-service design and debt-management policies.
These decisions shape service quality, safety exposure, operating cost and financial resilience long after
the original expenditure has been approved.
A credible strategic-management system therefore links board-level intent to day-to-day operational control.
It establishes a line of sight from the utility’s mandate through strategic objectives, departmental plans,
measurable performance indicators, risk controls and funded work programmes.
Strategic principle
A utility should not measure activity merely because it is easy to count. It should measure outcomes that
demonstrate whether customers are receiving dependable service, whether assets are being protected, whether
people are working safely and whether public funds are being used responsibly.
This is increasingly important as networks accommodate distributed generation, electric vehicles, battery
storage, advanced metering, demand response and more variable generation profiles. Global electricity systems
require stronger, more flexible and better-managed grids; the International Energy Agency estimates that annual
grid investment will need to increase by approximately 50% by 2030 from around USD 400 billion today.
Source: International Energy Agency.
2. Building an Executable Utility Strategy
A strategy is executable only when it makes choices. It must identify the outcomes the utility is accountable
for, the constraints under which it operates, the principal risks it faces and the capabilities it must build.
Aspirational statements have value, but they become useful only when translated into specific targets,
ownership and resourced delivery plans.
2.1 Start with a clear strategic mandate
The strategic mandate should distinguish between the utility’s long-term aspiration, its present purpose and
the non-negotiable outcomes it must achieve.
Strategic element
Purpose
Illustrative electricity-utility statement
Vision
Defines the desired future state
“A resilient, affordable and low-carbon electricity service that enables inclusive economic growth.”
Mission
Defines the utility’s present purpose
“To plan, operate and maintain electricity infrastructure that supplies safe, reliable and financially sustainable service.”
Strategic planning must be grounded in a structured assessment of internal capability and external conditions.
A generic SWOT exercise is insufficient unless it is supported by operational, financial, asset and customer
data. The objective is to identify the few conditions that can materially improve or constrain performance.
Internal assessment
Asset condition, criticality and maintenance backlog
Network capacity, loading, protection coordination and fault performance
Technical and non-technical energy losses
Revenue collection, debtor ageing and billing accuracy
Workforce capability, succession risk and contractor dependence
Control-room, outage-management, GIS and asset-information maturity
Safety performance and regulatory compliance
External assessment
Electricity regulation, tariffs and licensing requirements
Municipal or shareholder fiscal constraints
Economic growth, customer demand and affordability pressures
Distributed energy resources and customer self-generation
Technology change, cyber security and data-governance requirements
Climate exposure, severe-weather risk and environmental obligations
Supply-chain availability and cost escalation for critical equipment
2.3 Translate strategy into measurable objectives
Strategic objectives should be outcome-oriented and time-bound. They should not read as a list of routine
activities. “Replace transformers” is an activity; “reduce failure-related customer interruption minutes on
critical feeders by 20% by the end of the planning period” is an objective that connects work to a measurable
service outcome.
Example: From aspiration to execution
Strategic outcome: Improve continuity of supply.
Objective: Reduce unplanned customer interruption duration on the distribution network within three years.
Evidence: SAIDI, SAIFI, CAIDI, repeat-fault rate, planned-maintenance completion and critical-asset health indicators.
3. Designing a Useful KPI Architecture
A KPI is useful only when it supports a management decision. Utilities often accumulate large dashboards that
report operational activity without showing whether strategic performance is improving. A more disciplined
approach uses a small number of executive KPIs, supported by diagnostic operational measures that explain
movement in the headline indicators.
3.1 Principles for selecting KPIs
Strategic relevance: Each KPI must link directly to a strategic outcome, statutory duty or material risk.
Clear definition: The numerator, denominator, source system, exclusions and reporting period must be documented.
Assigned accountability: One accountable executive should own the outcome, even where delivery is cross-functional.
Data integrity: The indicator must be auditable and supported by consistent source data.
Actionability: A deteriorating result must trigger a defined management response.
Balanced perspective: Financial indicators alone are insufficient; reliability, safety, customer, environmental and asset-risk measures are equally necessary.
Trend visibility: Performance should be evaluated against baseline, target, prior period and—where appropriate—peer benchmarks.
3.2 Use leading and lagging indicators together
Lagging indicators confirm what has already happened. They are essential, but they do not by themselves prevent
deterioration. Leading indicators monitor the conditions that precede failure and therefore provide management
with time to intervene.
Is cash generation sufficient to sustain operations and renewal?
Safety
Lost-time injuries, high-potential incidents
Safety-critical training completion, field-audit findings closed
Are controls functioning before a serious incident occurs?
Capital delivery
Cost overruns, delayed commissioning
Design readiness, procurement lead time, permitting status, project risk exposure
Will the capital plan deliver the intended network capability on time?
4. Core Reliability and Operational KPIs
Reliability metrics should be interpreted as a coherent set. A single index can improve while the underlying
customer experience or network risk deteriorates elsewhere. For example, fewer interruptions may be achieved
through operational switching, while restoration time, backlog risk or the cost of emergency response rises.
The dashboard should therefore combine customer outcomes, network condition and work-execution measures.
4.1 Essential continuity-of-supply measures
KPI
Definition
Why it matters
SAIDI
System Average Interruption Duration Index:
Sum of customer interruption durations ÷ total customers served
Measures the average duration of sustained interruption experienced by customers during the reporting period.
SAIFI
System Average Interruption Frequency Index:
Total number of customer interruptions ÷ total customers served
Measures how often the average customer experiences sustained interruption.
CAIDI
Customer Average Interruption Duration Index:
SAIDI ÷ SAIFI
Measures average restoration time for customers affected by an interruption.
MAIFI
Momentary Average Interruption Frequency Index, where applicable under the adopted standard and event definition.
Tracks short-duration interruption exposure, which can affect sensitive commercial and industrial loads.
Repeat-fault rate
Number or proportion of repeat faults on the same asset, feeder or circuit within a defined period.
Highlights recurring defects that routine fault restoration may be masking.
SAIDI and SAIFI quantify the duration and frequency of sustained electricity interruptions experienced by
customers. The United States Department of Energy notes that a sustained interruption is generally one lasting
at least five minutes, although the utility must apply the standard and exclusion rules adopted by its regulator
or governing framework consistently.
Source: U.S. Department of Energy.
4.2 A balanced executive KPI scorecard
The following scorecard provides a practical starting point. Final targets should be set using the utility’s
historical baseline, customer-service commitments, network topology, regulatory requirements, affordability
limits and approved asset-management plan.
Strategic dimension
Executive KPI
Supporting diagnostic measures
Typical reporting cadence
Customer service
SAIDI, SAIFI, complaint-resolution rate
Call-answer time, outage-notification compliance, billing-query turnaround
Monthly
Network performance
Technical-loss percentage, unplanned outage rate
Feeder loading, voltage complaints, transformer failure rate, repeat faults
Monthly
Asset management
Critical-asset health index, maintenance-plan compliance
Condition-assessment coverage, defects overdue, backlog by risk category
Energy efficiency initiatives, emissions inventory quality, waste and spill controls
Quarterly
5. Budgeting and Capital Prioritisation
Budgeting is the mechanism through which strategy becomes real. A budget that is disconnected from asset risk,
service outcomes and delivery capacity may appear financially compliant while creating future reliability,
safety or affordability problems. The goal is not simply to minimise annual expenditure; it is to optimise the
balance between cost, performance and risk over the asset life cycle.
ISO 55000 frames asset management as a way of realising value from assets across their life cycles, while
ISO 55001 provides a management-system structure for balancing asset-related cost, performance and risk in
support of organisational objectives.
Source: ISO 55000:2024Source: ISO 55001.
5.1 Separate the budget into decision categories
Operating expenditure
Routine maintenance, fault response, staffing, system operations, vegetation management, ICT,
metering operations, customer service and contracted services.
Capital expenditure
New network capacity, asset replacement, automation, substations, lines, cables, communications,
control systems and customer-connection infrastructure.
Lifecycle renewal
Planned intervention to manage end-of-life, obsolescence, condition deterioration and unacceptable
asset-risk exposure before catastrophic failure occurs.
5.2 Apply zero-based budgeting with discipline
Zero-based budgeting can be useful where historic allocations have become detached from present priorities.
Unlike incremental budgeting, it requires expenditure to be justified from a zero base rather than assuming
that the previous year’s budget is inherently valid. Used properly, it can expose obsolete activities,
duplicated contracts, low-value programmes and expenditure that is no longer aligned with strategic outcomes.
However, zero-based budgeting should not be used as an indiscriminate cost-cutting exercise. In an asset-heavy
utility, deferring essential inspection, maintenance or renewal may reduce short-term expenditure while
increasing failure probability, restoration costs, safety exposure and customer interruption risk. Every
proposed reduction should therefore be tested against its impact on service, safety, compliance and asset risk.
5.3 Prioritise capital using risk, value and readiness
A transparent capital-ranking model prevents investment decisions from being driven primarily by visibility,
political pressure or the ability of a project sponsor to advocate for a scheme. Each candidate project should
be assessed consistently against defined criteria.
Assessment criterion
Question to test
Potential evidence
Safety and statutory compliance
Does the project mitigate an intolerable safety risk or mandatory compliance obligation?
Risk assessment, audit finding, statutory requirement, protection study
Reliability impact
How much customer interruption risk will be reduced?
Outage history, criticality analysis, SAIDI/SAIFI contribution, fault data
Asset condition and consequence
What is the probability and consequence of asset failure?
Condition assessment, failure mode, age profile, spares availability
Capacity and growth
Does the project resolve a forecast capacity constraint or enable priority connections?
Load forecast, feeder loading, development plan, connection pipeline
Financial value
Does it reduce lifecycle cost, prevent losses or protect revenue?
Lifecycle cost model, loss study, revenue analysis, avoided-emergency-cost estimate
Strategic alignment
Does it support approved resilience, digitalisation, decarbonisation or service goals?
Can the project be delivered within the funding period?
Concept design, permits, land rights, procurement strategy, supplier lead times
Budgeting test
Every material operating or capital item should answer four questions: What outcome will it deliver? What
risk does it reduce? What happens if it is deferred? How will the utility prove that the intended benefit
has been realised?
6. Governance, Reporting and Review Cadence
Strong governance ensures that performance information changes decisions rather than becoming a reporting
ritual. The board or governing authority should receive concise, decision-oriented reporting: material
deviations, emerging risks, corrective actions, funding implications and matters requiring escalation.
Operational detail should remain available, but executive reports should focus attention on what needs action.
6.1 Establish a clear performance-review rhythm
Forum
Cadence
Primary focus
Expected output
Operational performance review
Weekly
Faults, safety events, work orders, outages, urgent defects and field constraints
Recovery plans, resource decisions and risk escalation
Asset and capital review
Quarterly
Asset-health risk, renewal priorities, programme delivery and lifecycle expenditure
Reprioritised capital plan and asset-risk decisions
Board or governing authority review
Quarterly
Strategic outcomes, material risk, financial sustainability, compliance and major decisions
Governance oversight, approvals and accountability actions
Strategy refresh
Annually
Changing demand, regulatory environment, technology, funding assumptions and performance baseline
Updated strategic plan, targets and multi-year budget
6.2 Make performance reporting decision-ready
A high-quality monthly performance pack should include the current KPI result, year-to-date trend, approved
target, prior-year comparison, material cause of variance, forecast year-end position, risk assessment and a
named corrective action. Red-amber-green status alone is not adequate because it does not explain why
performance has moved or what management will do next.
Use a single approved KPI dictionary to prevent inconsistent definitions across departments.
Distinguish controllable performance from external-event impacts, but do not use exclusions to conceal persistent weakness.
Escalate adverse trends early, before annual targets become unrecoverable.
Link every material red KPI to a corrective action, accountable owner, completion date and benefit measure.
Audit critical data flows, particularly outage, billing, metering, asset and work-management data.
Review whether positive KPI movement reflects genuine customer and asset outcomes rather than reporting artefacts.
7. A Practical 90-Day Implementation Roadmap
Utilities do not need to redesign every process before improving strategic control. A focused 90-day programme
can establish the baseline, clarify accountability and create the foundation for stronger planning and
performance management.
Days 1–30
Establish the baseline
Confirm the strategic mandate, service obligations and material risks.
Map existing KPIs, data sources, reporting definitions and owners.
Identify the ten to fifteen most decision-critical executive indicators.
Assess asset-risk exposure, maintenance backlog, revenue leakage and capital-delivery constraints.
Document the current budget structure and major cost drivers.
Days 31–60
Design the management system
Approve strategic outcomes and measurable objectives.
Create a KPI dictionary with definitions, formulas, targets, sources and accountable owners.
Develop a balanced executive scorecard and operational drill-down dashboard.
Define a risk-based capital prioritisation model.
Introduce a standard monthly performance-review template.
Days 61–90
Embed accountability
Run the first formal KPI and budget-performance review.
Validate data quality for the most material reliability, financial and asset measures.
Assign corrective actions for adverse trends and overdue risk controls.
Reconcile the capital programme with asset criticality, delivery readiness and available funding.
Publish the annual performance calendar, governance forums and escalation thresholds.
From Measurement to Utility Value
The purpose of strategic management is not to produce a larger dashboard or a more elaborate budget pack.
It is to create a utility that can make better decisions: decisions that improve continuity of supply,
protect critical infrastructure, strengthen financial sustainability, manage risk transparently and deliver
credible value to customers and stakeholders.
When strategy, KPIs, asset management and budgeting are integrated, management can move beyond reacting to
outages and financial variances. It can anticipate risk, allocate resources deliberately and demonstrate
that every material programme contributes to a safer, more reliable and more sustainable electricity service.
Need a Utility Performance Framework?
Agulhas Utilities Corporation assists electricity utilities, municipalities and infrastructure organisations
with strategic planning, KPI design, asset-management alignment, capital prioritisation and performance-reporting frameworks.
From Time-of-Use Tariffs to a Home That Responds for You
Smart meters, solar export credits and home energy-management systems can help households
choose when to charge an EV, heat water, run large appliances, store solar energy or export it
when the feed-in value is high.
The central principle
A smart meter is primarily a secure revenue-metering device. It records electricity imported
from the grid and solar electricity exported to the grid, including the time at which the flow
occurs. A home energy-management system, or HEMS, uses that information with tariff data and
household preferences to control compatible appliances.
What the smart meter does
Measures separate import and export energy in kWh
Records time-of-use periods and interval energy data
Supports prepaid billing and solar export-credit settlement
Provides verified records for the electricity bill
Can provide authorised near-real-time energy information
What the HEMS does
Reads electricity prices and solar export credits
Monitors PV generation, battery state and household demand
Schedules EV charging and flexible appliances
Protects comfort, mobility and backup-power requirements
Lets the customer override automation at any time
Important: the meter by itself does not automatically make a home respond to
price changes. The customer needs access to a published tariff schedule or electronic price feed,
a compatible HEMS, and controllable equipment such as a smart EV charger, inverter, battery or
appliance controller.
How the system works
The smart meter remains the source of truth for billing. The HEMS uses forward-looking tariff
information and real-time household conditions to decide whether a flexible load should run,
pause, charge or wait.
1Tariff information is published. The municipality, retailer or supplier makes
TOU periods and import/export rates available through a tariff calendar, API, customer portal,
OpenADR signal, or approved local interface.
2The HEMS reads household conditions. It receives information on PV output,
grid import/export, EV charging state, battery state of charge and appliance availability.
3The HEMS applies household rules. It first protects the EV departure-energy
target, minimum battery reserve, hot-water needs and critical household circuits.
4Compatible devices respond. The HEMS can pause EV charging, run a geyser,
start a pool pump, limit a battery or switch flexible appliances within the customer’s settings.
HEMS decision = tariff value + real-time solar and household conditions + customer constraints
HEMS tariff-response animation
The interactive example below shows how a HEMS can compare future import costs with present
feed-in credits. It selects between charging an EV from rooftop PV, pausing flexible demand to
export solar, resuming charging, or waiting for a lower-cost period.
Solar, EV and tariff decision simulator
Choose a scenario or press play. The HEMS does not merely follow price: it preserves the
customer’s EV departure requirement, battery reserve, critical loads and manual override.
Current decision: 11:30
R
Real-time household conditions
Solar PV output5.0 kW
Household load1.2 kW
Solar surplus3.8 kW
EV energy required by 06:0018 kWh
Battery reserve selected30%
T
Forward tariff information
Import tariff nowR1.40/kWh
Export credit nowR0.55/kWh
Later import tariffR3.10/kWh
11:30
Export R0.55
12:00
Export R3.70
13:30
Export R0.65
18:00
Import R4.20
⚡
HEMS decision
Charge the EV from solar surplus
The current export credit is low relative to the later avoided import cost. The HEMS uses
available PV surplus to charge the EV while preserving the customer’s charging deadline.
EV charging: 3.6 kW
Why? One additional solar kWh is worth more when it avoids a later high-cost
import than when it earns the current low export credit.
Customer rules always remain in force
EV ready by 06:00
Battery reserve ≥ 30%
Critical loads protected
Manual override available
The revenue meter remains the authoritative source for import and export settlement. The
HEMS uses tariff data and customer-approved automation to manage compatible household devices.
Useful technology standards
Different standards address different parts of the system. A municipality or supplier should
avoid forcing customers into a closed appliance-control ecosystem. The meter, tariff platform,
HEMS, inverter and EV charger can be interoperable while still serving distinct functions.
System layer
Relevant standards or interface
Function
Smart metering and prepayment
NRS 049, IEC 62056 DLMS/COSEM, IEC 62055 STS
Revenue metering, import/export registers, tariff configuration and prepaid settlement
Tariff and flexibility signals
OpenADR, REST API, MQTT or structured tariff file
Current and future electricity prices, export credits and demand-response events
PV, battery and inverter control
IEEE 2030.5, SunSpec Modbus or approved inverter API
DER monitoring, operating status, capability and coordinated control
EV charging
OCPP and ISO 15118
Charging schedules, power limits and communication between charging equipment and EVs
Home appliances
Matter, Zigbee, Wi-Fi, KNX, Modbus or manufacturer API
Local control of compatible appliances, geysers, pumps and smart plugs
What tariff providers should publish
A dynamic or time-differentiated tariff is only fair when customers can see it and respond to
it. The tariff programme should therefore include data access and customer safeguards—not merely
a revised list of R/kWh charges.
Time-of-use calendar: peak, standard and off-peak periods; seasons; weekends;
public holidays; effective date; and version number.
Separate import and export prices: households should see both the price paid
for imports and the credit received for exported PV.
Machine-readable tariff data: provide a documented API, MQTT service, CSV/JSON
file or comparable digital interface that a customer-authorised HEMS can access.
Forward prices: dynamic tariffs should make next-day or future interval prices
available early enough for EV and battery scheduling.
Interval-level settlement data: customers need access to imports, exports,
tariff periods and the tariff version used for billing and export-credit settlement.
Consumer protections: manual override, informed consent, critical-load exclusions,
privacy safeguards and a clear route for queries or disputes.
A smart tariff should be a useful customer signal
Smart meters and time-of-use tariffs can help households lower costs, use more rooftop solar
locally and support a more flexible electricity system. They work best when the customer receives
the price signal electronically, can connect their chosen HEMS, and remains in control of household
priorities.
Practical model:
Bidirectional smart meter + interval settlement data + machine-readable tariff signal +
customer-controlled HEMS + compatible EV charger, battery, inverter and appliances.
Why voltage imbalance, harmonics, phase geometry and weak network conditions can quietly inflate costs, reduce asset life and compromise the reliability of industrial power systems.
Voltage quality
Symmetrical components
Harmonic distortion
Network resilience
The central risk
Power supply is more than an outage question
Electricity reliability is not defined only by whether lights remain on. For commercial, industrial and critical-load facilities, the decisive question is whether the supplied three-phase voltage is balanced, correctly sequenced, sinusoidal and stable as operating conditions change.
A facility can have apparently normal average voltages, a functioning revenue meter and no recorded interruption—yet still experience motor overheating, variable-speed-drive trips, unexplained process interruptions, elevated kVA demand, shortened asset life and potentially hazardous touch-voltage conditions.
The root cause is often power quality: the combined effect of phase-voltage asymmetry, negative-sequence components, harmonic distortion, transient voltage excursions and unequal network impedance.
The measurement gap
Why “normal voltage” readings can be misleading
A conventional investigation often ends after a handful of spot readings. But phase voltage is a vector quantity: RMS magnitude alone does not reveal phase-angle displacement, waveform distortion or the sequence components that place equipment under stress.
A credible assessment measures more
Phase-to-neutral and phase-to-phase voltage magnitudes
Relative phase angle and phase sequence
Positive-, negative- and zero-sequence components
Voltage and current harmonic spectra, including THD
Voltage dips, swells, interruptions and rapid changes
Neutral current, current imbalance, kW, kVAr, kVA and power factor
The ideal relationship
For a balanced three-phase system with equal phase magnitudes and 120° separation:
VLL = √3 VLN
Once magnitude or angular relationships depart from the balanced condition, this simple relationship no longer tells the whole story.
Sequence analysis
Symmetrical components expose the invisible imbalance
Symmetrical Component Analysis resolves an unbalanced three-phase system into balanced sequence systems. It turns a difficult electrical problem into components that have distinct causes and physical consequences.
Three-phase system = Positive sequence + Negative sequence + Zero sequence
Positive sequence
Normal A–B–C phase rotation. This is the intended operating component that produces normal motor torque and expected system behaviour.
Negative sequence
Reverse phase rotation caused by asymmetry. It can produce reverse-rotating magnetic fields, counter-torque, rotor heating and torque pulsation.
Zero sequence
In-phase components often associated with neutral, earth-return or fault-related current paths and their associated risks.
Negative-sequence voltage is particularly consequential for motors: it establishes a reverse-rotating field against the rotor’s intended direction, increasing thermal and mechanical stress.
Thermal amplification
Small voltage imbalance can produce disproportionate current stress
Even a modest voltage imbalance deserves attention. Agulhas Utilities Corporation’s published analysis notes that a 1% voltage imbalance can result in a 6% to 10% phase-current imbalance, depending on the equipment and operating condition.
Because resistive heating rises with the square of current, the resulting loss increase is not linear:
Ploss = I2R
That extra heat can accumulate in windings, cables, transformers, switchgear and high-resistance connections—often before a simple voltage check identifies the underlying issue.
1%Voltage imbalance
6–10%Potential current imbalance
I2RThermal-loss relationship
Potential symptoms include elevated winding temperature, torque pulsation, vibration, abnormal noise, speed instability, insulation ageing and repeated drive or overload trips.
Waveform integrity
Harmonics make the waveform part of the fault
Modern networks contain nonlinear loads: variable-frequency drives, rectifiers, UPS systems, LED drivers, battery chargers, solar photovoltaic inverters and industrial power-electronic processes. These loads draw nonsinusoidal current that interacts with network impedance and distorts the voltage waveform.
Some harmonic orders—including the 5th, 8th, 11th and 14th—have negative-sequence characteristics. They rotate in the opposite direction to the positive-sequence fundamental and can intensify counter-torque and localized heating in motors and generators.
Operational consequences
Excess transformer, cable and motor heating
Capacitor-bank overloading and resonance risk
Nuisance trips and maloperation of protection devices
Reduced power factor and increased apparent-power demand
Control-system malfunction and sensitive electronic-equipment disruption
Measurement, demand and billing complications
Voltage geometry
Oblique voltage geometry: the condition basic instruments miss
“Oblique” voltage and current conditions occur when the three phase waveforms no longer preserve their intended geometric relationship. One phase may experience reduced magnitude, altered timing, waveform distortion or shifted zero crossings relative to the others.
This is why a system can appear energised while sophisticated controls fail. Variable-speed drives, soft starters, PLCs, relays and electronic power supplies respond to instantaneous waveform conditions, DC-link stability and phase-loss thresholds—not merely to averaged voltage.
Stable lighting is not proof of healthy industrial power. A facility can retain illumination while control equipment trips or resets because of phase-angle anomalies, distorted waveforms or rapid voltage events.
Cost and demand
Why kW, kVAr and kVA belong in the same conversation
Power-quality weaknesses have a financial dimension. A facility may impose much more apparent-power demand on the network than its useful real-power output would suggest.
Quantity
Symbol
Unit
Meaning
Real power
P
kW
Power converted into useful work, heat or light
Reactive power
Q
kVAr
Power exchanged to sustain electric and magnetic fields
Apparent power
S
kVA
Combined electrical demand imposed on the supply system
Ideal sinusoidal relationship
S2 = P2 + Q2
Power factor = P / S
In distorted or unbalanced systems, this idealized power triangle is incomplete. Harmonic content and phase asymmetry complicate the relationship between useful output, current draw and apparent-power demand.
Billing and operational implications
Where tariffs include kVA demand, poor power factor, imbalance and distortion can contribute to avoidable cost. A defensible billing conclusion, however, requires interval data, tariff analysis, meter-configuration review and harmonic-aware measurements over a representative billing period.
Evidence before conclusion
Transmission integrity
Grid geometry and untransposed lines
Not every imbalance originates within the customer installation. The physical geometry of an overhead line influences phase self-inductance, mutual inductance and capacitance. If conductor positions are not periodically exchanged, each phase can experience a different average impedance along the corridor.
Line transposition rotates conductor positions so that each phase occupies each physical position for approximately equal distances. Its purpose is to balance phase electrical characteristics over the full line length.
P = (|V1||V2| / X) sin δ
Voltage depression reduces the maximum active power transferable across a reactance-limited path. In low-inertia systems, the interaction of voltage events, inverter controls, harmonic propagation and phase asymmetry requires more deliberate measurement and planning.
Field method
A practical diagnostic programme
A credible investigation replaces isolated measurements with a structured evidence process that connects electrical events to equipment behaviour, operating conditions and tariff exposure.
Define the complaint profile. Record affected equipment, symptoms, timestamps, production state, weather conditions, generator status and known utility switching events.
Install class-appropriate monitoring. Measure RMS voltages, phase angles, sequence components, current imbalance, harmonic spectra, THD, neutral current, kW, kVAr, kVA, power factor and voltage events.
Correlate electrical and plant events. Compare drive faults with dips, motor temperature with sequence imbalance, breaker trips with harmonic or inrush conditions, and production loss with event timestamps.
Identify the source before prescribing a cure. Investigate load distribution, fuses, contacts, joints, transformer characteristics, feeder asymmetry, capacitor banks, nonlinear loads and upstream network conditions.
Apply targeted mitigation and verify it. Possible actions include load redistribution, repair of defective components, harmonic filtering after network study, capacitor-bank redesign, dynamic balancing and appropriate negative-sequence protection.
Safety and governance
When power quality becomes a safety and leadership issue
A persistent tingling sensation from taps, sinks, machinery frames, metallic pipework or building structures should never be treated as normal. It demands urgent investigation by a competent electrical professional because it may indicate deficiencies involving earthing, bonding, neutral integrity, leakage current or fault-return paths.
Do not leave potential touch-voltage conditions unresolved. Isolate the risk, investigate the installation and verify compliance with applicable electrical-safety requirements.
The executive case
Engineering: protect motors, drives, transformers, cables and controls from premature degradation.
Operations: reduce process interruptions, nuisance trips and control-system resets.
Finance: limit avoidable kVA demand, energy waste, downtime and unplanned replacement costs.
Governance: manage safety, production, regulatory and capital-replacement risk through evidence-based oversight.
Power Quality & Regulatory Insights•Industry Analysis
5 Shocking Takeaways from South Africa’s Electricity Legal Wars
PQ
By Small Business Owner & Power Quality Consultant
Independent Grid & Tariff Advisory
For years, South Africans have been told that the solution to a collapsing national grid is private initiative. We were encouraged to bleed our own savings into rooftop solar to keep the lights on and relieve pressure on a failing state utility. Yet, in a cruel and calculated irony, those who successfully achieved energy independence are now being hunted by the very authorities they sought to escape.
Recent high-stakes battles in the North Gauteng High Court have unmasked a regulatory environment in total crisis. From “secret” settlements that would have vaporized billions in consumer wealth to blatant attempts to tax the sun itself, the veil of transparency has been torn back. These aren’t just legal disputes; they are a desperate attempt by “cash cow” municipalities and a complicit regulator to punish self-sufficiency.
1
Takeaway 1: The Rise of the “Sunlight Tax”
In the Thaba Chweu Local Municipality, residents who invested in solar panels to escape grid instability were met with a predatory new charge: a fixed monthly levy of R582.64. The sheer audacity of this “Sunlight Tax” is best illustrated by its enforcement: the municipality has been charging this fee even on households that are completely disconnected from the municipal grid.
This isn’t an isolated extortion attempt. The Emfuleni Local Municipality recently tried to steamroll a R2,400 solar registration fee alongside a R463 monthly fixed charge. These levies represent a dangerous administrative precedent—punishing residents for a service they literally do not receive. It is a regulatory fiction designed to bridge the gap caused by years of municipal debt and administrative abuse.
“This is an unlawful, irrational, and unreasonable tax on sunlight.”
2
Takeaway 2: The 130-to-3 Compliance Gap
The “Cost-of-Supply” (COS) study is the only legal shield consumers have against arbitrary price hikes. By law, tariffs must reflect the actual, efficient cost of distribution, not a thumb-sucked number used to balance a failing budget. Yet, the investigation into NERSA’s 2025/2026 tariff approval process unmasked a massive regulatory fraud.
While NERSA publicly claimed that 130 municipalities had submitted the required COS studies, the truth was far more scandalous: only three municipalities had actually provided complete, lawful studies. The other 127 submitted nothing more than “watered-down explanations” that lacked any accounting rigour.
The Actionable Reality for Consumers
According to the landmark AfriForum v NERSA 2024 ruling, if your municipality failed to submit a compliant COS study, they are legally prohibited from raising your rates. Only 66 municipalities in the entire country were found to be compliant at the time of the order. If yours isn’t one of them, your municipality must continue to levy rates based on the 2023/2024 tariffs. Any increase beyond that is a R-billion-rand illegality.
3
Takeaway 3: No More Charging for Inefficiency
For too long, NERSA’s methodology allowed municipalities to treat electricity bills as a subsidy for their own incompetence. A major victory by the Pietermaritzburg and Midlands Chamber of Business and the Nelson Mandela Bay Business Chamber has finally put an end to this “inefficiency tax.”
The High Court unmasked a methodology that essentially forced consumers to pay for “rampant electricity and cable theft” and a systemic “lack of infrastructure maintenance.” The court’s ruling is clear: tariffs must be based on the efficient cost of distribution. Municipalities can no longer pass the bill for their own decay onto the ratepayer.
“This case will potentially impact the determination and approval of electricity tariffs charged by municipalities across the country, ultimately benefiting all South African businesses and consumers.”
4
Takeaway 4: The Halted R107 Billion “Secret” Deal
In late 2025, NERSA and Eskom attempted a financial maneuver so egregious it bordered on the conspiratorial. Claiming a “calculation error” in NERSA’s adjudication of Eskom’s allowable revenue, the two entities tried to settle a dispute behind closed doors. This “secret” deal would have hiked tariffs by nearly 9% without a single minute of public consultation.
While the settlement attempt was pegged at R54 billion, the shock figure now on the table is a staggering R107 billion. Had this deal been made a court order, the impact on your pocket would have been devastating:
Original 2026 Hike: 5.36%→ Settlement Hike: 8.76%
Original 2027 Hike: 6.19%→ Settlement Hike: 8.83%
Analysts suggest that once the full R107 billion is recalculated into the system, the actual jump could hit 10% to 11%. The court rightly rejected this attempt to “negotiate away the rights of electricity consumers,” affirming that transparency is a non-negotiable component of lawful regulation.
5
Takeaway 5: The End of “Steamrolling” via Binding Timelines
NERSA and Eskom have spent years “steamrolling” consumers by submitting applications so late that public participation becomes a hollow, box-ticking exercise. The North Gauteng High Court has finally ended this malfeasance by imposing a strict regulatory regime with binding annual deadlines.
These timelines protect your right to participate before municipal budgets are finalized. Crucially, the court now requires that the ERTSA (Retail Tariffs Structural Adjustments Application)—the document that dictates the very structure of your bill—be submitted early enough for real scrutiny.
Key Binding Dates for the Electricity Calendar
31 AugustDeadline for Eskom to submit its ERTSA application.
31 JanuaryNERSA must notify municipalities in writing of wholesale tariffs.
20 MarchFinal deadline for municipalities to submit tariff applications to NERSA.
5 MayNERSA must issue final decisions and communicate reasons immediately.
The 2% Problem: Why Your Power Quality Report Says Everything Is Fine While Your Motors Quietly Burn
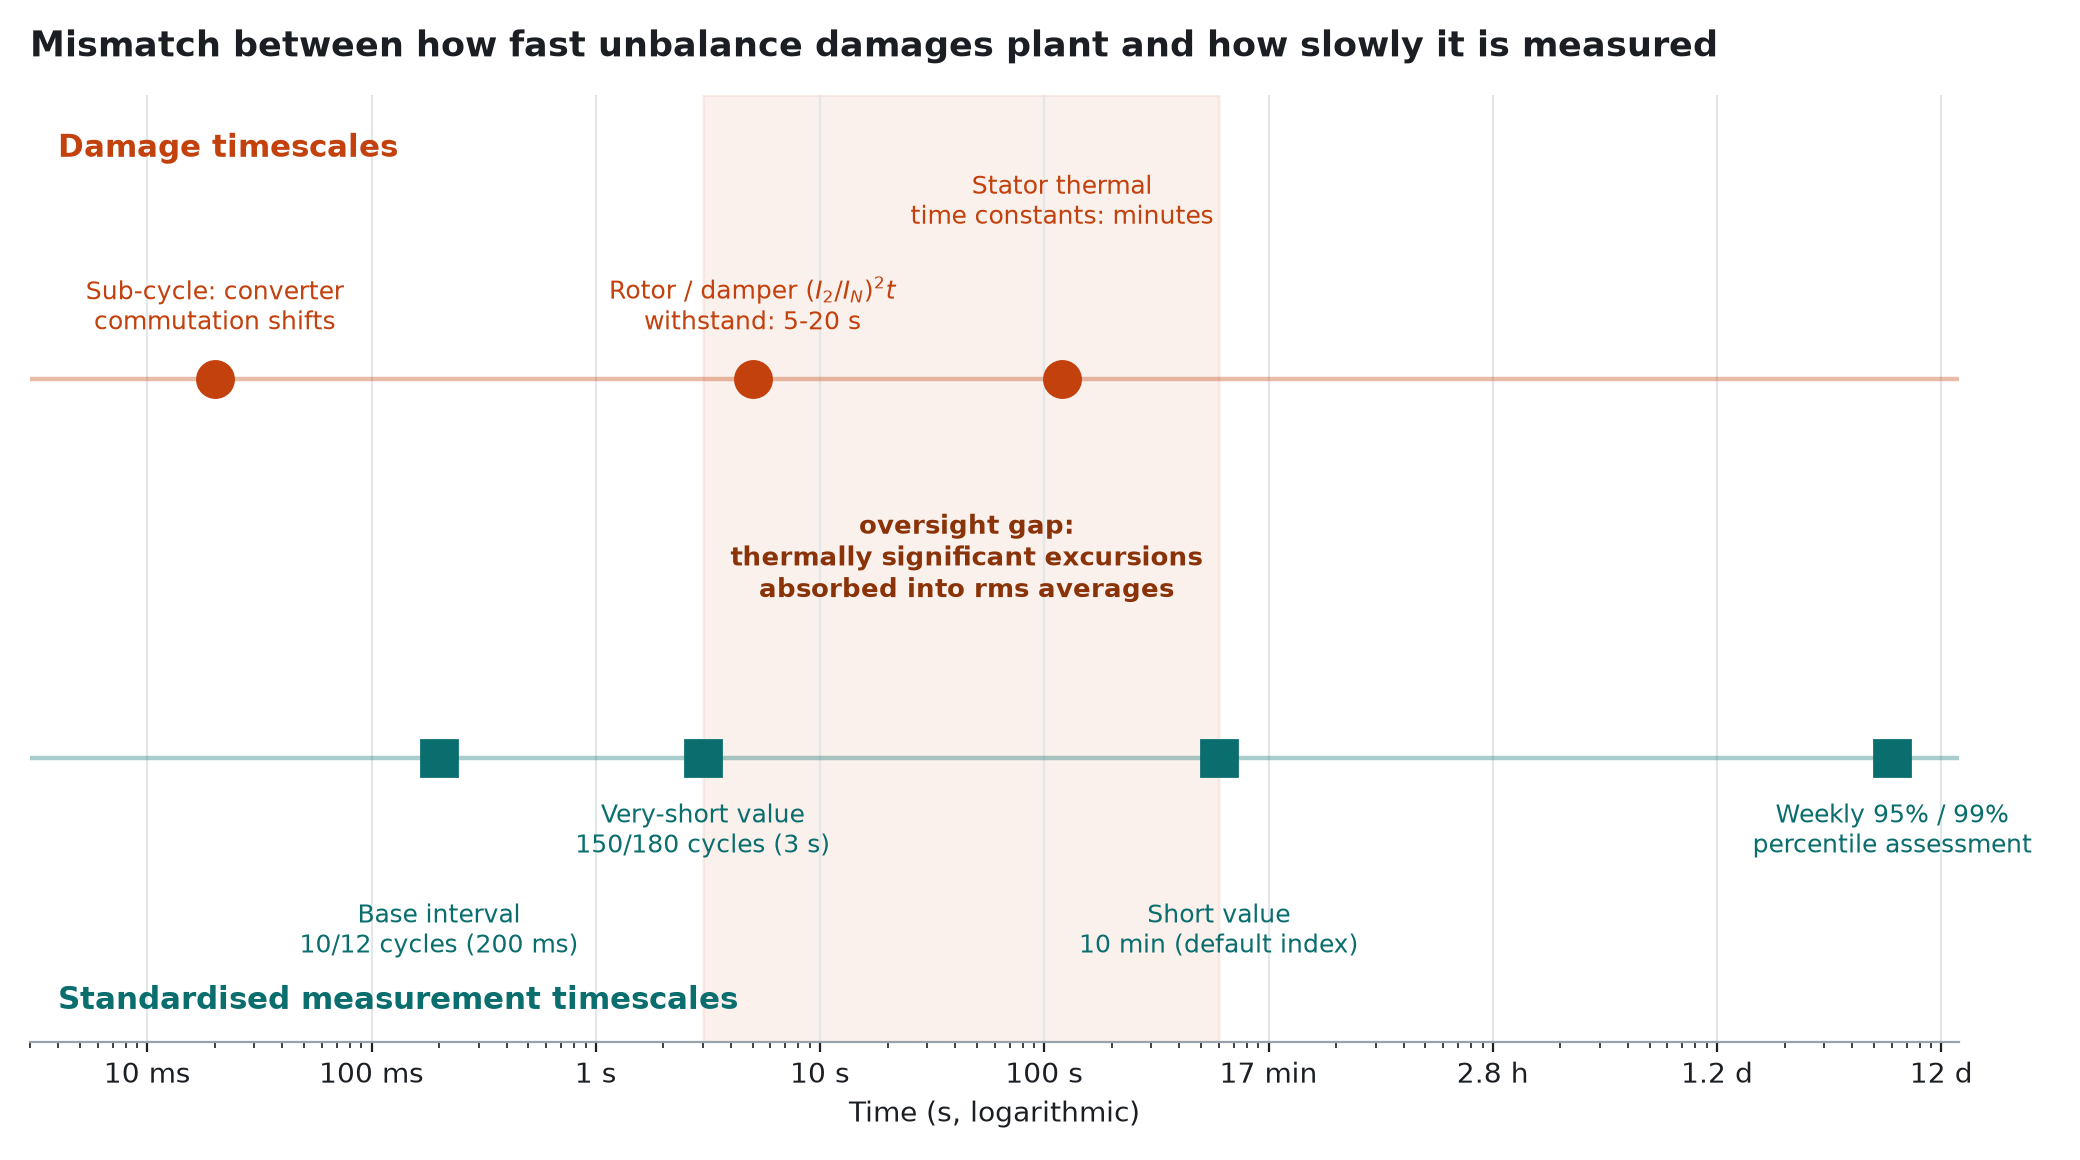
Voltage unbalance is the most under-instrumented parameter in power quality and, per unit of measured magnitude, one of the most destructive. Here is how a number small enough to pass every compliance test in force manages to cook rotors, kill drive capacitors, melt neutral conductors and heat transformer tank walls — and why the way we measure it guarantees we will not see it happen.
A plant manager calls you because three identical motors on the same busbar have failed in eighteen months. The maintenance file shows nothing unusual. The bearings were fine. The alignment was checked. The last power quality survey, done properly with a Class A instrument, came back clean: voltage unbalance sitting comfortably at 1.4%, well inside the 2% compatibility level, with no exceedances flagged for the entire monitoring week.
Everything in that file is accurate. And everything in that file is beside the point.
The uncomfortable truth about voltage unbalance is that the number on the report and the stressor inside the machine are two different quantities, separated by a chain of averaging operations that were designed for a phenomenon that behaves very differently from the one causing the failures. A voltage unbalance factor of a few percent — a value that passes almost every regulatory test in force — produces negative-sequence stator currents of 40% to 64% of rated current in modern induction motors. It halves winding insulation life through a temperature rise that scales with the square of unbalance. It forces three-phase rectifier front ends into quasi-single-phase conduction. It more than doubles cable losses where a neutral is present. And it pushes zero-sequence flux into transformer tank walls where no core path exists to carry it.
None of this is secret. All of it is documented in standards that engineers cite routinely. What is missing is a measurement and enforcement chain fast enough to act on any of it.
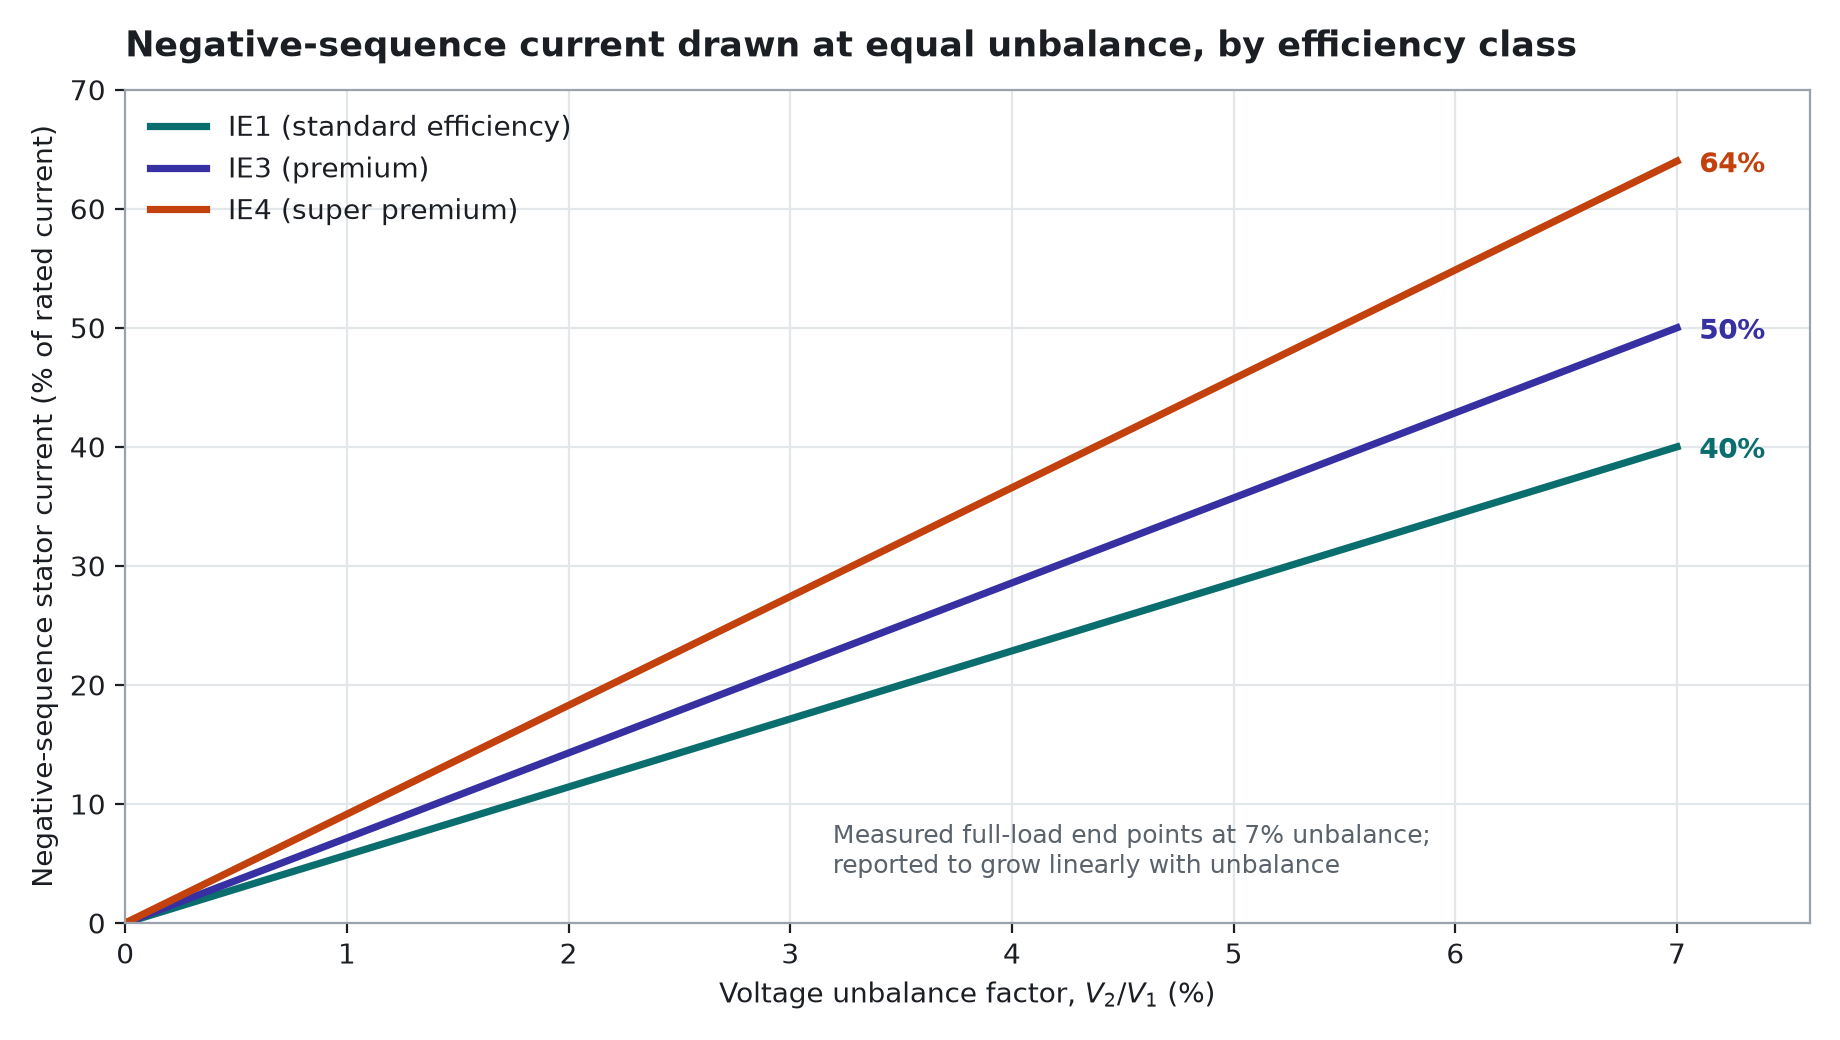
64%of rated current drawn as negative sequence by an IE4 motor at 7% unbalance
50%extra stator winding temperature rise at 5% unbalance
2.06measured cable power-loss factor versus the balanced case
€12minsurance claim from one neutral conductor failure
First, a definition problem hiding in plain sight
Three definitions of unbalance coexist in everyday practice, and they are not interchangeable. This is not pedantry — the choice of definition determines whether you can see the problem at all.
The true definition, and the only one with a physical basis, is the ratio of the negative-sequence to the positive-sequence voltage component:
VUF = (V₂ / V₁) × 100%
The NEMA Line Voltage Unbalance Rate does something different. It takes the maximum deviation of any line voltage from the average of the three, divided by that average. The IEEE Phase Voltage Unbalance Rate runs the same computation on phase voltages. Both discard phase-angle information entirely, which means neither can distinguish a magnitude-only unbalance from an angular displacement that produces identical magnitudes but a substantially different negative-sequence component (University of Cape Town thesis on voltage unbalance).
That distinction matters because the negative-sequence component is the thing that does the damage. Everything else is a proxy. The IEEE motor protection guide states the consequence about as plainly as a standards document ever states anything:
It is the negative-sequence component that actually jeopardizes the motor… Hence, simple unbalance measurements may not provide the degree of motor protection required.
IEEE Std C37.96-2000, clause 5.7.2.3
Read that sentence twice, because it undercuts a great deal of routine practice. If your protection scheme, your trend log, or your acceptance test is built on line-voltage deviation ratios rather than sequence decomposition, you are measuring a shadow of the stressor and inferring the stressor from the shadow.
There is also a structural mismatch buried in the limits themselves, and once you see it you cannot unsee it.
Framework
Quantity
Stated value
IEC 60034-1:2017, clause 8.3.1 / IEEE 112-B
Unbalance permitted during motor thermal and efficiency testing
Negative-sequence voltage at motor terminals, continuous
1% of positive sequence; 1.5% for a few minutes (IEC 60034-1)
NEMA MG 1
Motor voltage unbalance
Derate above 1%; never operate above 5% (UCT thesis)
NRS 048-2:2025, clause 4.2.4.2
Network compatibility level
2% at LV/MV/HV; 3% permitted where single- and two-phase customers predominate (NERSA)
Machines are type-tested in conditions cleaner than 0.5% and warranted for continuous duty at 1%. Networks are planned to 2% and tolerated at 3%. That is a gap of two to six times between the environment in which a machine was proven and the environment into which it is sold. Nobody is being dishonest. The standards simply were not written to talk to each other.
The motor is being braked, not just heated
This is the concept most often lost in translation, and it is genuinely interesting once the physics comes into focus.
Unbalanced terminal voltages resolve into two sets of balanced voltages. The positive-sequence set produces the airgap field you intended: rotating forward, doing useful work. The negative-sequence set produces a second field rotating in the opposite direction. That field does not simply add heat. It fights the shaft.
Voltage unbalance, resulting in negative sequence voltage components at the motor terminals, produces a flux in the motor air gap which opposes the direction of rotation, creating additional braking torque, potentially causing motor stalling.
CIGRE US National Committee
The protection literature describes the same mechanism from the operational side: negative-sequence currents reduce the available accelerating torque, which lengthens the acceleration time and further contributes to motor overheating (IEEE Std C37.96-2000). A longer start means more seconds at high current, which means more heat, which means the thermal penalty of unbalance compounds itself at exactly the moment the machine is most vulnerable.
And the mechanical consequence is not confined to a reduction in mean torque. Because the two fields rotate in opposite directions, their interaction with the rotor produces a torque ripple at twice the fundamental frequency, superimposed on the useful shaft torque and transmitted straight into bearings, couplings, keys and driven machinery (analysis of unbalanced supply effects). A drivetrain specified for a smooth 50 Hz machine is quietly absorbing a 100 Hz alternating load nobody put in the specification. Relay manufacturers treat this as a known signature: phase unbalance and broken-phase conditions cause additional heat losses and local overheating of the rotor as well as mechanical vibrations (ABB negative-sequence protection documentation).
So when a vibration analyst finds an unexplained 100 Hz component and a maintenance team keeps replacing couplings, the root cause may not be mechanical at all. It may be sitting in the transformer tap setting or the single-phase load distribution three levels upstream.
Why the rotor takes the worst of it
Here is the detail that explains the severity. Slip with respect to the negative-sequence field is (2 − s). A machine running at 2% slip therefore presents a slip of roughly 1.98 to the reverse-rotating field. Rotor currents are induced at nearly double supply frequency (CIGRE), which is squarely in the band where skin effect raises effective rotor bar resistance — so the same current produces more heat than it would at fundamental frequency.
Worse, the machine’s negative-sequence impedance is close to its locked-rotor impedance. The motor presents a very low impedance to negative-sequence voltage and therefore drinks it greedily. This is the mechanism behind a rule of thumb every field engineer should carry: current unbalance is usually six to ten times the voltage unbalance (Power Monitors Inc.). A 3.13% voltage unbalance measured in the field produced 37% to 40% current unbalance and a derating factor of 0.88 — a 10 HP machine reduced to 8.8 HP of usable output.
At the extreme, thermal damage becomes structural. Excessive rotor heating can deform rotor bars, leading to catastrophic mechanical failure (CIGRE). The failure that arrives as a bang and a shower of laminations began as an arithmetic problem in the symmetrical components.
Heat that compounds: the square law nobody budgets for
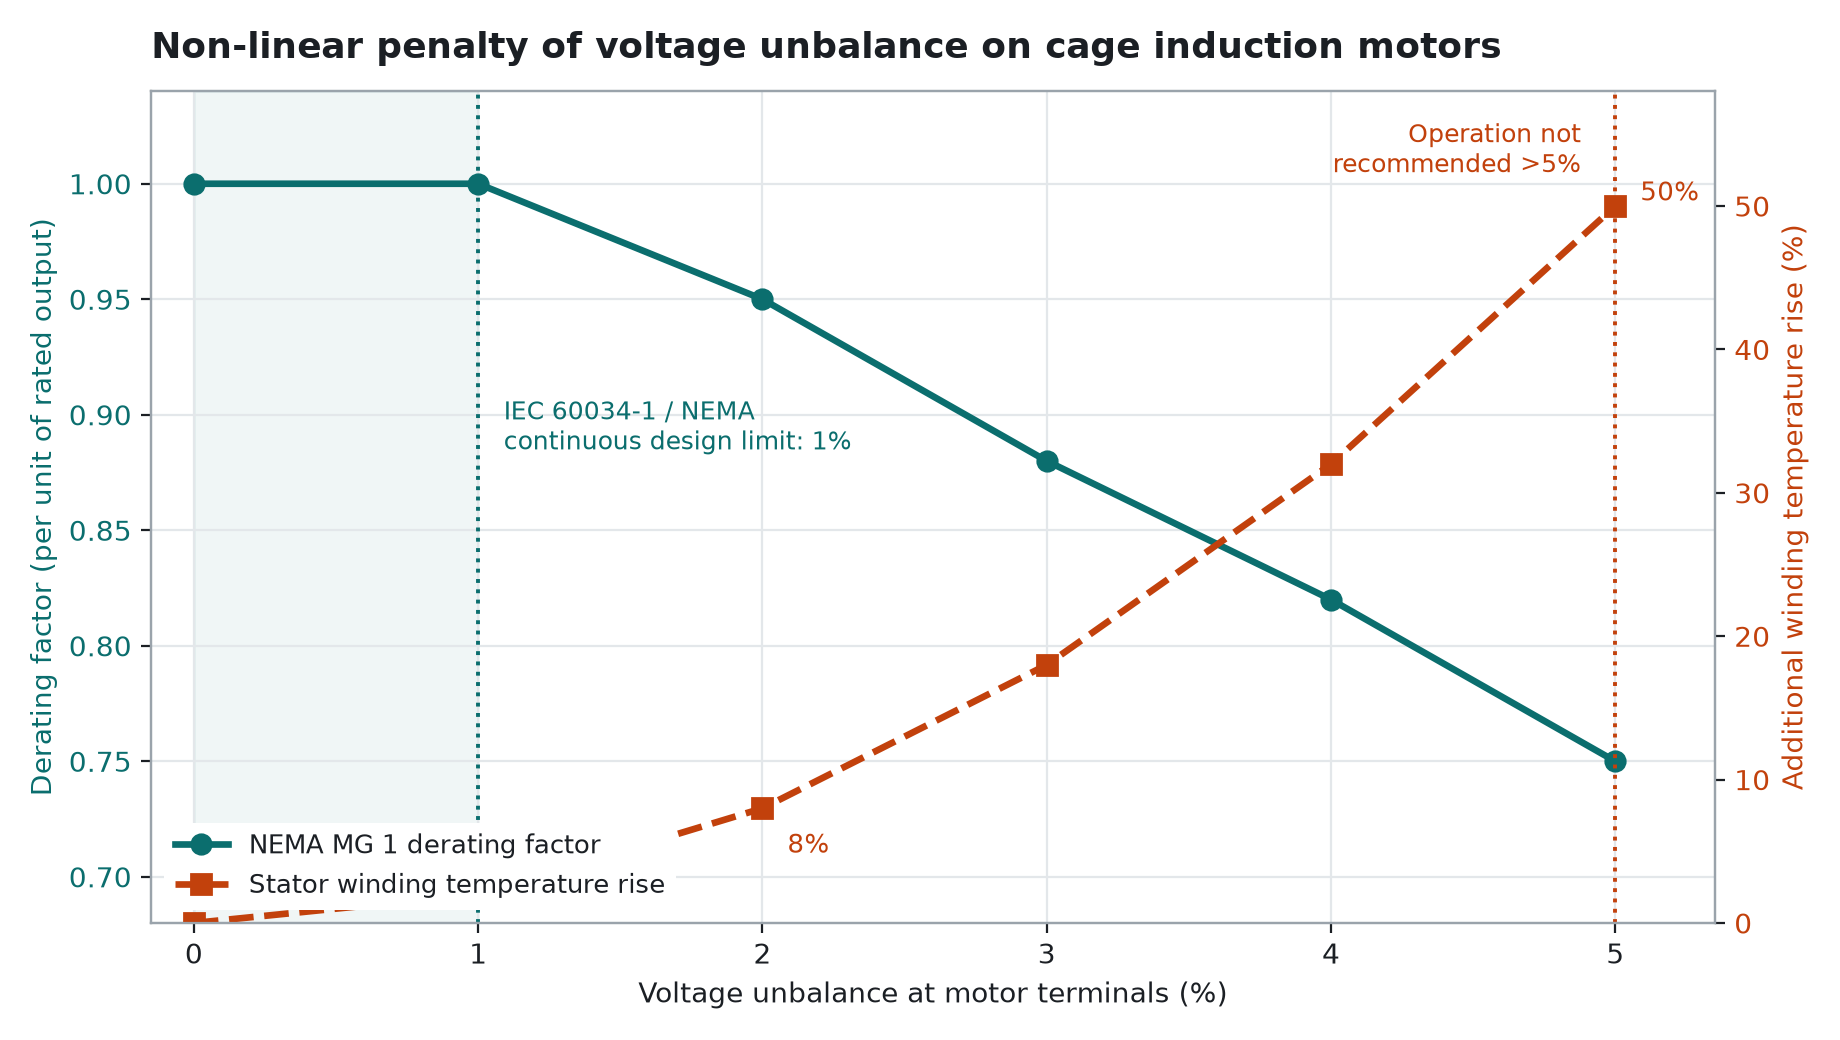
The penalty is not linear. Derating falls gently while temperature rise accelerates sharply.
Additional stator winding temperature rise follows a square law in unbalance. The percentage rise is approximately two times the square of the percentage unbalance: 8% at 2% unbalance, 18% at 3%, 32% at 4%, and 50% at 5%. The same source pairs that arithmetic with an unambiguous verdict — unbalance above 2% is unacceptable — and with the ageing law that makes it matter: average insulation life expectancy halves with every 10 degrees of temperature rise (ABB power conditioning technical paper).
+8%temperature rise at 2% unbalance
+18%at 3% unbalance
+32%at 4% unbalance
+50%at 5% unbalance
Put those two statements together and the economics change shape. The NEMA MG 1 and IEEE 141 derating curve falls from 1.00 to 0.75 as unbalance rises from 1% to 5%, with motors designed for continuous full-load operation only at 1% (Derating of Induction Motors Due to Power Quality Issues). A 25% derate sounds survivable — you oversize the motor and move on. Sizing guidance says as much: to develop 10 kW reliably at 3% unbalance, specify roughly 12 kW or a 1.15 service factor (Power Quality Australia Technote 6).
But derating protects the output. It does not undo the temperature rise on a machine that was not derated, and most installed machines were not. Those machines are not running at reduced output. They are running at rated output with an extra 18% or 32% of temperature rise, converting an expected twenty-year insulation life into something closer to ten, or five. That loss is invisible until the day the winding fails, and it does not appear on any trend log because temperature rise is not what anybody is trending.
The efficiency paradox: your best motors are your most exposed
At identical unbalance, the higher-efficiency machine draws substantially more negative-sequence current.
This is the finding that should change specification practice, and it is counterintuitive enough that it deserves a section of its own.
Measured negative-sequence currents at a voltage unbalance factor of 7% reach 40% of nominal current for an IE1 machine, 50% for IE3, and 64% for IE4 — corresponding to negative-sequence resistances of 2.1 Ω, 1.73 Ω and 1.26 Ω respectively. The decisive conclusion: the standard NEMA derating curve remains adequate for IE1 and IE3 machines but is insufficient for IE4 machines above a voltage unbalance factor of 3.5% (Derating of Induction Motors Due to Power Quality Issues).
The physics is almost cruelly logical. Efficiency gains come largely from reducing winding and rotor resistances. Lower resistance means lower negative-sequence impedance. Lower negative-sequence impedance means more negative-sequence current admitted for the same negative-sequence voltage. The very design choices that earn the IE4 label make the machine a better absorber of the thing that damages it.
Which produces an uncomfortable policy collision: energy-efficiency mandates and unbalance tolerance pull in opposite directions, and the derating tables embedded in the standards predate the machine population now being installed. A plant that upgrades to premium-efficiency motors to cut its energy bill, in a network sitting at 3% unbalance, may have quietly traded an operating cost for a reliability cost — and the derating table it consulted will have told it everything was fine.
There is a second trap layered on top. NEMA MG 1 Part 30 derates for harmonic content on the explicit assumption that voltage unbalance is negligible (NEMA MG 1 Part 30). The two derating mechanisms were never designed to be superimposed. Real installations experience both simultaneously, and no standard tells you how to combine them.
Converters: the rectifier that thinks it is single-phase
Rotating machines are only half the story. Three-phase diode rectifier front ends — the grid interface for variable-speed drives, servo systems, UPS units and switch-mode supplies — respond to unbalance in a completely different and arguably more insidious way.
During voltage unbalance events, three-phase diode rectifiers are forced to enter in single-phase operation mode which can generate low-order harmonic components (100 Hz, 300 Hz etc. at 50 Hz mains) in DC-link voltage. These low-order voltage harmonics significantly raise the AC-flux densities of DC-link capacitors.
Aalborg University, presented at APEC
Two things follow, and both are the kind of problem that gets misdiagnosed for years.
First, the harmonic spectrum changes character rather than merely growing. A six-pulse converter is normally a source of 5th, 7th, 11th and 13th harmonics. Under unbalance, triplen line-current harmonics uncharacteristic to these rectifier systems can exist, leading to unexpected harmonic problems (Power Quality Australia Technote 6). Your six-pulse drive becomes a source of third-harmonic current that the four-wire installation downstream was never assessed for. Independent work confirms that a slightly unbalanced grid causes large current unbalance and non-characteristic harmonics in three-phase uncontrolled rectifiers (IET Power Electronics). If you have ever chased a mysterious third harmonic in an installation with no obvious single-phase load, this is a candidate.
Second, the increased ripple current flows into the DC-link capacitor bank, dissipates in the equivalent series resistance, and raises core temperature. Aluminium electrolytic capacitor life obeys the Arrhenius ten-degree rule, halving for every 10 °C rise in operating temperature (TDK, ROHM, Nippon Chemi-Con).
So a modest, chronic unbalance does not trip anything. It does not alarm. It expresses itself as a halved capacitor service interval, observed three or four years later as a population of drives failing early — failures that get attributed to the drives, the manufacturer, the ambient temperature, or the panel design. Almost never to the supply.
There is a neat irony here too. Three-phase UPS output quality is specified precisely in these terms: output imbalance is defined by negative-sequence and zero-sequence percentages (UPS design thesis, METU). The converter suffers unbalance at its input and is held contractually accountable for unbalance at its output.
IT infrastructure: €12 million, and it started in the neutral
Data centres and commercial IT loads combine two mechanisms that are individually manageable and jointly dangerous. Load unbalance across phases produces a fundamental-frequency neutral current. Separately, the triplen harmonics inherent to single-phase switch-mode supplies are zero-sequence, so they add arithmetically in the neutral instead of cancelling.
Unbalance alone is a modest neutral stressor. A purely linear unbalance of 12, 10 and 8 A yields only 3.5 A of neutral current — a neutral loading factor of 0.35 (MDPI Energies, neutral conductor loading analysis). Unbalance combined with triplen harmonics is a different animal entirely.
The documented outcome is sobering. In a 2019 Nordic data centre event, a neutral conductor failure took 40% of server capacity offline for three weeks and produced an insurance claim exceeding €12 million. The facility was 800 racks of single-phase switch-mode supplies behind a 2 500 kVA dry-type Dyn11 11 kV/400 V transformer, serving 1 600 kW of IT load and 400 kW of cooling on a 400/230 V TN-S system. The neutral carried 1.73 times the phase current. Neutrals sized equal to the phase conductors reached over 180 °C. Insulation degraded, the UPS tripped on a ground fault, PDU busbars were damaged, and connectors melted (ECAL data centre case study).
1.73×phase current carried by the neutral
180 °Creached by neutrals sized equal to the phases
3 weekswith 40% of server capacity offline
€12m+insurance claim from the event
The measured harmonic spectrum from that event is worth studying closely, because it is the clearest illustration of the sequence mechanism you will find in a real installation: 80% at the 3rd, 60% at the 5th, 40% at the 7th, 20% at the 9th, 12% at the 11th, 8% at the 13th, 5% at the 15th.
Now sort those by sequence. The 3rd and 9th are zero-sequence, and they load the neutral. The 5th and 11th are negative-sequence, and they impose reverse-rotating fields on every motor sharing that busbar — including the chillers and fans of the cooling plant that keeps the servers alive. The 7th and 13th are positive-sequence. One distorted load population attacks the neutral, the transformer and the motors by three separate routes simultaneously.
And here is why it went unnoticed: a total harmonic distortion figure reports magnitude only. It cannot tell you what share of that distortion is negative-sequence and therefore aimed at your rotating plant. The number on the report was almost certainly recorded. Its meaning was not.
Cables: the quiet paths that stop being quiet
Under balanced sinusoidal conditions, the cable neutral and the metallic sheath carry effectively no current. Cable ampacity ratings are computed on exactly that assumption. Negative- and zero-sequence currents break it.
The loss increase factor relative to the balanced case can be written as one plus the square of the negative-sequence current ratio plus the square of the zero-sequence ratio weighted by the ratio of zero- to positive-sequence resistance. For a 0.38 kV overhead line with a neutral cross-section equal to the phase conductors, that resistance ratio is 4, so zero-sequence current is four times as expensive in loss terms as an equivalent negative-sequence current. Field measurements at an Irkutsk substation, part of a study spanning more than thirty years, found neutral current 21.3% above the mean phase current in winter and 26% in spring, with an average power-loss factor of 2.06 — losses more than double those of the balanced case (European Proceedings, power losses under unbalanced load).
Double the losses is not an efficiency footnote. It is a thermal input, and cable insulation is exquisitely sensitive to temperature. Cross-linked polyethylene is expected to last 40 to 60 years at its 90 °C rated operating temperature. Accelerated ageing tests to a 50% retention of elongation at break tell a much shorter story once you climb above that:
Conductor temperature
Estimated XLPE life, material A
Estimated XLPE life, material B
90 °C (rated)
40–60 years
40–60 years
95 °C
27.5 years
29.7 years
100 °C
13.9 years
14.9 years
105 °C
7.2 years
7.6 years
Data from an XLPE thermal ageing study. Read the pattern rather than the individual numbers: in the 95 °C to 105 °C band, a cable loses roughly half its remaining life for every additional 5 °C. Fifteen degrees above rated is not a 17% penalty. It is an 80% penalty.
At high voltage the failure mode moves to the sheath, and it becomes a self-reinforcing loop. Zero-sequence current arising from harmonics and unbalanced loading increases the sheath voltage and cable temperature, so cable faults occur at cable terminations in high-voltage underground lines (HV cable jointing and terminations review). Sheath circulating currents depend on the asymmetry of the load currents, the laying method and the length of the minor sections, and as unbalance increases, the circulating current in the cable sheath increases (Universidad Politécnica de Madrid). One monitored case recorded a sheath current peak of 60 A settling to 40 A for two hours, after which the cable experienced a joint failure (Tampere University thesis on cable sheath currents).
Then the loop closes: over-sheath faults themselves make sheath currents unbalanced (UPM doctoral thesis). Unbalance raises sheath current. Sheath current raises temperature and accelerates ageing. Ageing produces over-sheath faults. Those faults increase sheath current unbalance further. The degradation feeds itself, and no ammeter on a phase conductor will show you any of it.
Transformers: flux going where there is no iron
Transformers suffer twice under unbalance, and the second mechanism is the one that defeats conventional monitoring.
The first is conventional additional loss. Severe unbalance produces negative-sequence currents which adversely affect feeding transformers and generators through overheating and the development of hot spots, derating system capacity as a result (Kerala SERC technical filing). Since stray losses represent roughly 20% to 25% of total load losses (stray-loss analysis), any mechanism that multiplies stray loss has serious thermal leverage. Additional losses cause thermal damage in the insulation, iron core and windings (derating of asymmetric three-phase transformers).
The second mechanism has no analogue under balanced loading at all, and it is genuinely elegant in the way physics sometimes is when it is about to cost you money.
In a three-phase, three-limb core-form transformer, the three phase fluxes cancel and the resultant zero-sequence flux is null only while the phase currents are equal in magnitude and displaced by 120 degrees. Let terminal-voltage unbalance occur, and the fluxes no longer cancel. The residual flux has to go somewhere, and there is no core limb for it.
The zero-sequence flux jumps from the top yoke, passes through a huge air or oil gap, closes by cover and the tank wall, and returns to the bottom yoke… One of the dangerous consequences of the presence of zero-sequence flux is that the core, cover and tank may be heated to an unacceptable temperature due to additional stray losses.
Universidade de Vigo, RNM2D_0 stray-loss analysis
Eddy-current losses are responsible for the tank heating effect and are proportional to the magnitude of the zero-sequence flux inducing them. The same work reports that the additional losses generated on the tank wall are of great magnitude, and that prolonged operation with significant zero-sequence flux can result in excessive heating of metallic structural parts external to the core.
Now consider what that means for asset management. The hot spot is on the tank wall and the cover — not in the winding. Winding hot-spot models will not find it. Fibre-optic winding sensors will not find it. Top-oil thermal models will not find it. The affected steel is structural rather than electrically active, so nothing in a routine loss measurement reveals it. The exposed configuration is a Y-Yn unit without a delta tertiary winding or magnetic shunts, which describes a very large share of the installed distribution transformer population.
The consequence is governed by the Montsinger relationship in the loading guide: insulation life halves for approximately every 6 °C to 8 °C of hot-spot rise above rated, with normal life expectancy corresponding to a hot spot of at most 98 °C (IEEE C57.91-2011 loading guide). Because the loading equations take the load factor as an equivalent balanced current, a transformer sitting well inside its measured loading limits can be losing life at several times the expected rate through sequence losses that never enter the calculation.
The oversight gap: measuring a fast phenomenon with a slow instrument
Damage integrates in seconds. Compliance is assessed in weeks. The intervening averaging is what hides the problem.
Everything above is documented, mainstream engineering. So why does it keep surprising people? Because the measurement framework we all rely on is, by construction, incapable of showing it.
IEC 61000-4-30 Class A defines a chain of nested intervals: a base interval of 10 cycles at 50 Hz (about 200 ms), aggregated to 150 cycles (about 3 s), aggregated to 10 minutes on an absolute clock, aggregated to 2 hours (powerquality.blog on Class A). Aggregation is performed as the square root of the arithmetic mean of the squared input values (Sensors review of power quality measurement).
200 msbase measurement interval
3 sshortest reported index
10 mindefault reporting index
1 week95% percentile compliance window
That last detail is the whole ballgame. A quadratic mean over an interval is precisely the operation that converts a short, high excursion into a small increment of a long, low average.
Work the arithmetic. A 30-second excursion to 6% unbalance, embedded in a 10-minute window otherwise sitting at 1.2%, aggregates to a reported value of roughly 1.9%. That is inside every compatibility level in force. Meanwhile the rotor of an affected motor has just spent 30 seconds at a stressor that IEC 60034-1 permits only for a few minutes at 1.5%. The report says compliant. The machine says otherwise, and only the machine is right.
Then the number is reduced further. Compliance is assessed as the highest 95% weekly value (NRS 048-2:2025). Five percent of the 1 008 ten-minute intervals in a week — over eight accumulated hours — may exceed the compatibility level with no compliance consequence whatsoever.
Three features that remove the evidence on purpose
It gets more pointed. Three characteristics of the framework actively discard the most damaging data.
Class S instruments may sample intermittently. A minimum of three 10-cycle values must be used every 150-cycle interval — at least one every second (Sensors review). Three of fifteen base values means up to 80% of the record can simply be absent.
Fault-coincident data is deliberately flagged out. This is the most consequential of the three:
Asymmetrical faults are the single largest cause of severe transient unbalance. Asymmetrical faults produce voltage dips. Therefore the flagging rule systematically deletes the highest-negative-sequence events from the very record used to judge unbalance performance. The rule exists for a defensible reason — you do not want dip data polluting continuous-phenomenon statistics — but the side effect is that the worst unbalance in the week never appears in the unbalance statistics. The same guidance recommends shorter intervals while conceding that most European countries use 10-minute values, which is also the default value for most monitoring equipment.
Assessment is not site-specific. The CIGRE benchmarking work states that evaluation with respect to compatibility levels should be made on a system-wide basis, and that no assessment method is provided for evaluation at a specific location (CIGRE WG C4.27). The customer whose motor just failed cannot demonstrate non-compliance at their own point of connection using the framework’s own method.
Layer on the taxonomy problem and the picture completes itself. IEEE 1159 classifies unbalance as a steady-state phenomenon (IEEE 1159 panel material). A phenomenon classified as steady-state gets instrumented, aggregated and reported as steady-state, so the rapid excursions that matter are out of scope by definition of the class. The reasoning behind that choice — that small unbalance usually does not produce immediate negative effects but rather has long-term consequences (ICEST 2019) — is perfectly sound for small unbalance and wrong for large unbalance. The trouble is that after aggregation, the instrument can no longer tell the two apart.
The comparison that makes the argument
Set the two families of timescales side by side and the mismatch is impossible to argue with.
A cumulative integral of current squared over time
Headline statistic
Weekly 95% value
Cumulative insulation life loss, irreversible
Fault-coincident data
Flagged and removed
The largest exposure in the record
Locus of assessment
System-wide, no site method
Site-specific plant at the end of the feeder
Machine negative-sequence fault withstand is specified as a current-squared-time product of 5 to 20 seconds (IEC 60034-1). Rotor and damper thermal time constants sit in the same range. The framework’s shortest reported index is 3 seconds, its default is 10 minutes, and its compliance statistic is a weekly percentile. Damage integral and assessment statistic are separated by two to three orders of magnitude, and the averaging in between suppresses peaks by design.
The frustrating part is that the capability to close this gap already exists on both sides of the problem. A generalised likelihood ratio test detector achieves one-cycle detection latency and identifies 2.5% unbalance at 40 dB signal-to-noise ratio (Mitsubishi Electric Research Laboratories). Active voltage conditioners correct unbalance within 20 ms — less than one cycle (ABB). We can see it in one cycle and fix it in less than one cycle. What we lack is any requirement to report it, and therefore any commercial incentive to correct it.
EPRI names the same blind spot from the network side: one of the major gaps for continuous disturbance monitoring exists at the end of the distribution system (EPRI). Which is exactly where unbalance is largest, and exactly where the affected motors and IT loads are connected.
The South African case, and why the trend is getting worse
Working in a constrained network sharpens all of this considerably.
The South African framework tolerates 2% generally and up to 3% in rural networks (UCT thesis), with Eskom’s standard conditions of supply giving the contractual expression of that position (Eskom). But the most striking sentence in the current national standard is not a number at all:
Compatibility levels exist. Enforceable limits do not. To be fair, the standard is technically rigorous about the physics — it is explicit that only the negative-sequence contribution is quantified, because that is the relevant component when the impact on equipment is being considered. It identifies the right stressor and then declines to bound it.
Two local factors make that gap sharper. Extensive single-phase and two-phase reticulation is precisely the condition under which the standard relaxes the compatibility level to 3%, so the networks carrying the most unbalance are permitted the most of it. And repeated load-shedding subjects motors to frequent restarts, during which negative-sequence current reduces available accelerating torque and lengthens acceleration, further contributing to overheating (IEEE Std C37.96-2000). Thermal exposure per start is elevated at exactly the moment starts become most frequent and the network is weakest. Three compounding factors, arriving together, in the same week.
Globally, the trend runs the same direction. Photovoltaic- and EV-rich LV networks already exceed unbalance limits, with a General Summation Law applied where more than ten unbalanced installations combine or where unbalance varies randomly in time (MDPI Energies). Single-phase rooftop generation, single-phase EV charging and single-phase heat pumps are all unbalance sources whose diversity cannot be relied upon. The same source notes national codes as tight as 0.7% in Croatia — an order of magnitude tighter than a 3% rural allowance, and a good indication of how wide the spread of international practice remains.
Meanwhile, immunity testing exists for equipment rated up to 16 A per phase under IEC 61000-4-27 (IEC). Which leaves the large motors, drives and transformers that suffer most sitting outside any immunity test regime at all.
What it all comes down to
Strip away the standards numbers and one structural insight remains, and it is the reason this problem persists.
Every damage mechanism examined here is driven by a squared or exponential function of a quantity that is reported as a linear time-average. Rotor heating goes as current squared times time. Stator temperature rise goes as the square of unbalance. Cable and transformer stray losses go as the square of current magnitude. Insulation life decays exponentially with temperature under the Arrhenius and Montsinger laws.
The reporting chain does the opposite. It applies a quadratic mean over 200 ms, then over 3 seconds, then over 10 minutes, then takes a weekly percentile, and then discards the fault-coincident data. Squared damage functions integrated against averaged stress measurements produce a systematic underestimate — and the magnitude of that underestimate grows with the peakiness of the disturbance. Which is to say: the worse a network’s unbalance behaviour actually is, the more the measurement framework flatters it.
If you own or operate plant in a network sitting anywhere near its compatibility level, a few things are worth doing before the next failure rather than after it. Instrument sequence components rather than deviation ratios. Set negative-sequence overcurrent protection with an inverse-time characteristic matched to the machine’s own current-squared-time constant, so the relay integrates damage rather than averaging stress. Re-examine derating for IE4 machines, where the standard curve is documented as insufficient above 3.5%. Size neutrals in IT installations on measured triplen content, not fundamental unbalance. And take a thermal camera to the tank wall and cover of your Y-Yn transformers, because that is where the flux goes when there is no iron to carry it, and no winding sensor will ever tell you it went there.
Here is the thought worth sitting with. We can detect voltage unbalance in one cycle. We can correct it in less than one cycle. Every mechanism described above is documented in standards that engineers cite every week. And yet the compliance framework built on top of all that knowledge reports a weekly percentile of ten-minute averages, with the worst events deleted, and calls a network compliant.
So the question is not whether we understand voltage unbalance. We clearly do. The question is this: if the physics has been settled for decades and the technology to see and fix it already sits on the shelf, what exactly are we waiting for — and who is paying for the delay in the meantime?
Right now, the answer to the second half of that question is uncomfortably clear. The cost of unbalance is being paid, quietly and continuously, by the rotor bars, the DC-link capacitors, the neutral conductors, the cable joints and the transformer tank walls of the connected customer. It is being paid on a schedule nobody is measuring, against a standard that has declined to set a limit.
Primary sources referenced throughout include IEC 60034-1:2017, IEC 61000-4-30, IEC TR 61000-3-13:2008, IEEE Std C37.96-2000, IEEE Std 1159-2009, IEEE C57.91-2011, NEMA MG 1 Part 30, NRS 048-2:2025 (NERSA), the CEER Guidelines of Good Practice on Voltage Quality Monitoring, and CIGRE Working Group C4.27, alongside peer-reviewed measurement studies and documented field failures.
5 Surprising Ways Regulators Are Forcing Utilities to Clean Up Their Act
Power Quality & Regulation•By A Small Business Owner & Power Quality Consultant
Electricity is often perceived by the public as a simple binary: it is either on or it is off. However, as any strategic analyst will tell you, the “on” is only half the story. Behind every flickering light and humming data center lies the hidden complexity of Power Quality (PQ). For modern infrastructure, it isn’t enough for power to simply be present; the voltage must be stable, the frequency consistent, and the current clean. While consumers take this stability for granted, electricity regulators globally are moving beyond simple oversight. They are employing increasingly creative—and occasionally brutal—mechanisms to force utilities to innovate. From the UK’s threat of fines totaling 10% of a licensee’s turnover for license breaches to aggressive financial “carrots,” the era of the passive utility is over.
1
The Innovation Prize: Why Ofgem Prefers Carrots to Sticks
In the United Kingdom, the regulator Ofgem has pioneered a shift from mechanistic penalties to a philosophy of “paying for performance.” Historically, distribution businesses were automatically fined if their energy losses—electricity that disappears during transit—exceeded a target. During one regulatory period (DPCR4), a single business lost an average of £8 million per year under this “fine-heavy” model.
Today, the UK operates under the RIIO framework, a system designed to ensure that utilities aren’t just paid for building hardware, but for delivering results that the public actually needs.
Instead of punishing measurement errors, Ofgem now manages a £32 million discretionary reward scheme. This is effectively a “prize” fund where companies compete for rewards by proving the qualitative success of their innovation projects. By shifting from the stick to the carrot, Ofgem encourages engineers to find creative ways to reduce losses rather than simply managing the risk of a fine.
2
Skin in the Game: Namibia’s “Performance or No Pay” Ultimate Refund
While the UK uses innovation prizes, the Electricity Control Board (ECB) of Namibia utilizes a much sharper financial deterrent: the Performance Management Framework (PMF). This model creates an environment with absolute accountability, linking a utility’s technical score directly to its bottom line.
Under this framework, licensees are assessed on specific Key Performance Indicators (KPIs). The consequences of failing to meet these standards are severe:
Key Metric: If a licensee scores below 50% on its performance assessment, it faces a 0% pass-through penalty.
In utility economics, a “pass-through” allows a company to recover unexpected costs from the customer. A 0% pass-through means the utility’s shareholders—not the customers—must eat every dollar of cost variance. It is the ultimate “skin in the game” model, forcing the utility to absorb the financial hit of its own technical inefficiency.
3
Hitting the Bottom Line: The 38-Basis-Point Equity Trap
In Illinois, USA, regulators have moved the target from the utility’s operational budget directly to the investors’ pockets. For utilities like Commonwealth Edison (ComEd), failing to meet reliability and safety targets results in a direct reduction of the Return on Equity (ROE).
Under formula-based rate plans, failing to achieve targets for outage duration and frequency can decrease a utility’s earned ROE by up to 38 basis points.
From a strategic perspective, this is a devastating blow. ROE is the primary magnet for infrastructure investment. A 38-basis-point reduction does more than just cut this year’s profit; it signals “high risk” to capital markets. This can raise the cost of future debt, making it significantly more expensive for the utility to borrow the money needed for future grid upgrades.
4
The Transparency Revolution: Real-Time Visibility via NamPower
Namibia has taken a surprising technological lead in the use of transparency as a regulatory tool. While the UK relies on annual “close-down” reports that summarize projects after they are finished, the Namibian regulator has embraced real-time access.
Through NamPower, the country launched a web-based Power Quality (PQ) portal. This system provides the regulator and transmission customers with “unlimited access” to download technical reports directly from monitoring points. This level of transparency covers critical parameters like:
Total Harmonic Distortion (THD): Think of this as “electrical noise” or static. Too much THD can overheat industrial motors and damage sensitive electronics.
Negative Phase Sequencing (NPS): This refers to imbalances in the three-phase power system that can cause industrial equipment to vibrate and fail prematurely.
By giving stakeholders direct access to this data, the regulator prevents utilities from “massaging” the numbers in annual reports, ensuring that technical degradation is visible as it happens.
5
The Survival Gap: When Vandalism Trumps Voltage Quality
The transition to high-tech, output-based regulation is a luxury of stable environments. South Africa’s regulator, NERSA, provides a sobering counter-point to the sophisticated models of the West. While NERSA monitors technical standards (like NRS 048-6), it often operates within a “regulatory enforcement gap” where technical perfection is sidelined by basic survival.
In South Africa, the challenge isn’t just fine-tuning harmonics; it is keeping the wires in the air.
“Electricity theft, illegal connections, and copper theft account for an estimated 40% of unplanned power outages in Eskom and municipal networks.”
The scale of this crisis is best illustrated by the data: in a study of the Soweto network, the SAIDI (System Average Interruption Duration Index, or the total time a customer is without power) reached 30.36 hours per year. This is more than double the regulator’s target of 14.61 hours. Similarly, the SAIFI (System Average Interruption Frequency Index, or how often the power goes out) reached 7.07 interruptions against a target of 6.
“It is absurd that physical destruction causes 40% of power outages, yet technical safeguards are repeatedly deprioritized just to keep the grid financially afloat.””
Why a “Compliant” Grid is Quietly Melting Your Plant’s Motors
Imagine this scenario: you are a plant manager or systems engineer standing on a noisy, vibrating factory floor next to a critical 1,000 HP induction motor that has just tripped off-line due to a winding insulation failure. You check the utility’s monthly Quality of Supply (QOS) compliance logs, and everything is completely “green”. According to the utility’s reports, the voltage unbalance factor (VUF) is well within the regulatory limits.
You are left with a burnt-out stator winding, a six-figure repair bill, and a massive paradox. How can a power grid be 100% compliant on paper while physically destroying your rotating machinery and electrical assets?
The answer lies in a combination of temporal low-pass filtering, utility impedance masking, and the harsh laws of electromagnetic induction. Here is a technical deep-dive into why you cannot treat basic utility compliance data as a shield to protect your plant.
1. Symmetrical Components: The Mathematical “Symmetry Error Signal”
To understand why unbalance behaves so destructively, we must look to the mathematical framework established by Charles Fortescue in 1918. Symmetrical component theory allows any arbitrary, unbalanced set of three-phase vectors (currents or voltages) to be decomposed into three decoupled, balanced vector sets:
Positive Sequence (I1, V1): Three phasors of equal magnitude, displaced by 120°, rotating in the normal system direction (A → B → C). This represents the normal, balanced state that carries useful active power transfer.
Negative Sequence (I2, V2): Three phasors of equal magnitude and 120° spacing, but rotating in the reverse phase order (A → C → B) at the same system frequency.
Zero Sequence (I0, V0): Three in-phase phasors (0° angular displacement) that represent common-mode quantities. These require a physical neutral or ground path to flow.
Under perfectly balanced conditions, negative-sequence and zero-sequence components vanish. In real-world systems, single-phase loads, untransposed transmission lines, and asymmetrical impedances introduce unbalance. Negative-sequence components serve as a direct measure of unbalance—essentially a “symmetry error signal”.
2. The 10-Minute Averaging Illusion (Temporal Low-Pass Filtering)
The core standard governing utility power quality monitoring globally—IEC 61000-4-30 (Class A)—defines the measurement and aggregation methods that utilities must report to regulators. It specifies that continuous high-speed cycle data must be aggregated into fixed 10-minute clock-locked windows.
While a 10-minute window is statistically convenient for utilities, it acts as a severe mathematical low-pass filter that completely smooths out rapid, highly intermittent load variations.
If a severe unbalance or harmonic surge occurs intermittently (for example, during train acceleration on high-speed rail lines or the melt cycle of an industrial arc furnace), the peak value is mathematically diluted over the rest of the 10-minute block:
Aagg =
Ad · d + Abase · (T – d)
T
Where Aagg is the aggregated value reported by the meter, Ad is the magnitude of the parameter during the disturbance, d is the duration of the disturbance, T is the 10-minute window (600 seconds), and Abase is the quiet baseline.
The 10-Minute Power Quality Illusion (Interactive Simulation)
How standard utility averaging “erases” a highly destructive 3.0% unbalance spike down to a compliant average.
If a highly destructive unbalance spike (Ad = 10%) occurs for 2 minutes (d = 120 seconds) while the system is quiet (Abase = 2%) for the remaining 8 minutes, the reported 10-minute average is only 3.6%. This value is mathematically smoothed down.
Furthermore, because these 10-minute aggregation windows are rigidly locked to absolute clock boundaries (e.g., 08:00 to 08:10), a transient event can easily be split across consecutive windows. If an intense unbalance event overlaps a window boundary, the reported value is fragmented even further. Real-world testing reveals that under identical load conditions, a simple shift in the start of the measurement window can fluctuate the reported non-compliance rate between 6.6% and 10%. The utility’s weekly 95th percentile compliance reporting acts as a statistical eraser, keeping physical damage invisible.
3. The Impedance Masking Fallacy: Why Utilities Are Blind to Downstream Propagation
Even if a utility registers a clean voltage profile, the currents propagating through the system tell a different story. Negative-sequence voltage drops (V2) at any given bus are governed by the relationship:
V2 = –I2Z2
Where I2 is the injected negative-sequence current and Z2 is the negative-sequence system impedance of the network.
The critical factor is grid strength (short-circuit capacity, Ssc) at the Point of Common Coupling (PCC).
At the Utility Substation (Strong Grid): The primary substation is a heavy transmission node with low system impedance (Z2). Because Z2 is extremely low, the utility can absorb massive negative-sequence current injections (I2) from unbalanced loads while displaying a negligible voltage unbalance factor (V2 ≈ 0).
At the Customer Substation (Weak Grid): As you move down the distribution line into the customer’s substation, the system impedance (Z2) increases significantly. The very same negative-sequence current that appeared harmless at the utility bus now generates a severe, high-magnitude voltage unbalance (V2) on your plant’s weaker bus.
Because standard utility monitoring typically only tracks voltage unbalance (V2) and treats sequence current monitoring as entirely optional, this entire current-driven propagation remains hidden until it reaches your assets.
4. The Physics of Rotor Destruction: Why Motors Hate Negative Sequence
Three-phase induction motors are incredibly sensitive to negative-sequence voltages because they lack electromagnetic symmetry under unbalance. The opposing positive and negative fields inside the machine create a highly destructive set of physical stresses:
A. The Slip Relationship and Twice-System-Frequency Heating
Under normal operation, the rotor spins at a forward speed close to synchronous speed (ns), with a small positive-sequence slip (s ≈ 1% – 5%).
However, the reverse-rotating air gap magnetic field produced by the negative-sequence current rotates in the opposite direction (-ns). The relative speed between the forward-spinning rotor and this reverse air gap field is approximately twice the synchronous speed:
nrel = ns(1 – s) – (-ns) = ns(2 – s) ≈ 2ns
This reverse field cuts the rotor surface at twice the nominal system frequency—inducing currents at 100 Hz in 50 Hz systems and 120 Hz in 60 Hz systems directly into the rotor body, slot wedges, field windings, and damper bars.
B. Skin-Effect Compression and the 5x Resistance Multiplier
Because these induced currents flow at double-frequency (100/120 Hz), they are subject to a severe skin effect. Rather than distributing evenly through the rotor conductor cross-section, the eddy currents are compressed into a highly restricted, thin depth near the rotor surface.
This current compression increases the effective AC resistance of the rotor path to approximately 5 times the normal positive-sequence resistance (Rrotor,2 ≈ 5Rrotor,1). This massive resistance increase causes rapid I2R heating to concentrate directly in damper bars, rotor slot wedges, and retaining rings, risking structural failure under centrifugal forces.
C. The 6-to-10x Current Amplification Loop
Because an induction motor exhibits very low negative-sequence impedance (approximately equal to its locked-rotor reactance), a small voltage unbalance generates a disproportionately large negative-sequence current.
The resulting current unbalance is amplified to 6 to 10 times the magnitude of the voltage unbalance:
Current Unbalance (IUR%) ≈ (6 to 10) × Voltage Unbalance (VUR%)
A seemingly compliant utility voltage unbalance of 3% (the target for utility systems under ANSI C84.1) propagates into your motor as an 18% to 30% current unbalance.
This unbalance generates massive thermal losses that scale with the square of the unbalance current:
Additional Heat Loss ≈ (Current Unbalance %)2 × Base Losses
An 18% current unbalance creates 32% more heat loss inside your motor windings, raising operating temperatures by 30°C to 40°C. According to Arrhenius degradation kinetics, winding insulation life halves for every 10°C continuous temperature rise. A 3% voltage unbalance can therefore reduce your motor’s operational lifespan by up to 75%.
5. Front-End Distortion: The Variable Frequency Drive (VFD) Connection
Even if you run your motors through Variable Frequency Drives (VFDs) or Adjustable Speed Drives (ASDs) to bypass direct-on-line grid connections, voltage unbalance still introduces serious power electronic degradations.
Most three-phase VFDs utilize a standard 6-pulse diode rectifier bridge on their front-end to charge a common DC-link capacitor. Under balanced supply conditions, the diodes conduct in pairs, drawing a double-pulse current waveform that generates standard characteristic odd harmonics (5th, 7th, 11th, etc.).
However, the moment a negative-sequence voltage unbalance is introduced, the peak voltage differences between phases alter the diode conduction angles.
Asymmetric Diode Conduction: The input current morphs from a standard double-pulse waveform into a highly distorted, single-pulse waveform. This concentrates thermal stresses onto specific diodes in the rectifier bridge, leading to premature diode failures and the nuisance tripping of phase overload-protection circuits.
Uncharacteristic Triplen Harmonics: Under unbalanced voltages, the input currents begin injecting severe uncharacteristic triplen harmonics (specifically the 3rd and 9th harmonics) into your system. While a balanced VFD generates practically no 3rd harmonic current, a 3.75% voltage unbalance causes the 3rd harmonic to skyrocket to 83.7% of the fundamental current.
DC-Link Ripples and Capacitor Lifespan: This unbalanced conduction forces large 120 Hz voltage ripples across the DC-link capacitor, drastically decreasing its operational lifespan.
6. Symmetrical Harmonics: The Harmonic Sequence Map
In non-sinusoidal, harmonics-polluted environments (such as plants operating large numbers of VFDs, rectifiers, or single-phase switch-mode power supplies), each integer harmonic order (h) maps directly to a specific sequence component:
Harmonic Order (h = 3k ± 1)
Harmonic Order
Sequence Network
Mathematical Vector Behavior
Physical Grid Effects
Fundamental & 3k+1 (1st, 7th, 13th)
Positive Sequence (+1)
Normal phase rotation (A → B → C)
Contributes to normal motoring torque and system active power transfer.
3k+2 (5th, 11th, 17th)
Negative Sequence (-1)
Reverse phase rotation (A → C → B)
Generates counter-rotating torque, braking effects, and rotor surface heating.
3k (Triplen Harmonics) (3rd, 9th, 15th)
Zero Sequence (0)
Co-phasal (in-phase, 0° displacement)
Circulates in transformer delta windings; causes neutral conductor overloading and transformer hot spots.
7. Strategic Recommendations for Plant Operations
To ensure your facility is truly protected from poor power quality, you must move beyond the utility’s high-level statistical compliance metrics. Plant managers should implement a proactive, multi-layered defensive strategy:
A. Install High-Resolution, Event-Based PQ Monitoring
Stop relying on the utility’s monthly 10-minute average reports. Deploy continuous, high-speed Class A power quality analyzers on your side of the PCC. Set your instruments to track unbalance over 200 ms (10/12-cycle) and 60-second aggregation windows to capture the true, unmitigated physical peaks before they are mathematically diluted.
B. Deploy Dedicated Negative-Sequence Relay Protection
Ensure your critical motors and generators are equipped with modern numerical protection relays that actively run ANSI 46 (Negative-Sequence Overcurrent) and ANSI 47 (Negative-Sequence Voltage) protection.
Configure the ANSI 46 unbalance alarm at a low, conservative pickup threshold of 4% to 6% of the machine’s rated current with a definite-time delay of 5 to 10 seconds. This alerts operators to minor loading imbalances before any thermal damage accumulates.
Coordinate the ANSI 46 inverse-time trip (51Q) with the machine’s specific rotor heating limit constant (I22t = K):
tpermissible =
K
I22
This ensures the relay trips the breaker before the rotor damper bars or slot wedges reach their thermal limits.
C. Implement Sequence-Weighted Thermal Models (ANSI 49)
For complete motor thermal protection, utilize the ANSI 49 Thermal Overload function, which combines positive and negative sequence currents into an equivalent heating current (Ieq):
Ieq = √(I12 + βI22)
Ensure the unbalance weighting factor (β) is set between 3 and 6 to reflect the high AC resistance of the rotor paths caused by the double-frequency skin effect.
D. Active Symmetrization (Steinmetz Symmetrization)
If your facility is forced to draw highly unbalanced phase currents or operate next to highly fluctuating single-phase loads (such as railway traction lines or massive single-phase data centers), implement dynamic shunt compensation using Static Var Compensators (SVCs) or STATCOMs at your PCC.
By dynamically adjusting individual phase susceptances based on the Steinmetz Symmetrization Principle, these systems inject compensating negative-sequence currents that are exactly equal in magnitude and 180° out of phase with the unbalance, neutralizing it before it can propagate into your rotating assets.
Summary: Protecting Your Operations
Problem Source
Utility’s Compliant Data
The Physical Reality on Your Floor
Defensive Mitigation
Averaging Window
10-minute average averages out transient spikes.
Continuous peaks cause rapid, localized rotor heating.
200 ms / 60-second PQ logging to capture true transient unbalance.
Sequence Monitoring
Voltage-only monitoring (ignores current sequences).
Sequence current propagation amplifies unbalance downstream.
ANSI 46 current protection set to alarm at 4%–6% unbalance.
Grid Impedance
Strong utility bus masks unbalance voltage (V2 = –I2Z2).
Weak customer bus amplifies the voltage unbalance factor.
ANSI 47 overvoltage relays set to alarm at 3% negative-sequence voltage.
Asset Impact
Mathematically ignored by weekly 95th percentile limits.
Insulation life is halved for every 10°C temperature rise.
Ultimately, a power utility’s obligation is to meet high-level statistical guidelines designed to minimize network costs across a regional grid. Your obligation is to protect your facility, your rotating assets, and your bottom line. Moving beyond the 10-minute compliance illusion is the first step toward true power system reliability.
1. Introduction: The Invisible Complexity of the Solar Revolution
The rapid global expansion of solar power is widely celebrated as a triumph of green energy and a critical step toward decarbonization. However, beneath the surface of this transition lies a hidden reality: our aging distribution networks are facing unprecedented physical strain.
While the sun provides an abundant source of free energy, converting that energy into a form compatible with the existing power grid is not a seamless process. It introduces subtle, counter-intuitive engineering challenges that remain invisible to the average consumer but present significant hurdles for utility providers. Integrating high concentrations of solar power requires more than just panels; it requires managing the complex physics of an electrical system designed for a different era.
2. The Chaos of the “Uncoordinated” Rooftop
Most residential solar installations are connected to the grid as “single-phase sources” at the low-voltage level. When these installations grow rapidly without central coordination, they create a logistical nightmare for utility providers.
Because these rooftop arrays operate independently, their collective operation results in random, bidirectional power flows. This lack of coordination shifts the system’s neutral voltages and generates high-magnitude Negative Phase Sequencing (NPS). To understand NPS, imagine the grid as a precision machine rotating in one direction; NPS represents electrical components essentially trying to flow “backward” relative to that rotation. This creates a persistent state of voltage unbalance that compromises the stability and efficiency of the local network.
3. The 100Hz Ghost in the Machine
In “weak” distribution grids, unbalanced conditions introduce a phenomenon known as 2ω oscillations. In a standard 50 Hz system, this manifests as a 100 Hz ripple (or 120 Hz in a 60 Hz system).
These oscillations are particularly disruptive because they occur within the internal “synchronous reference frame” of the solar inverters. Specifically, they distort the Phase-Locked Loop (PLL) phase angle estimation—the very software mechanism the inverter uses to stay in “sync” with the grid’s frequency.
“These double-frequency oscillations… result in synchronization tracking errors and potential controller failure.”
This represents a surprising technical irony: the software meant to ensure solar energy flows smoothly into the grid can be “confused” by the grid’s own unbalance. If not managed, these 2ω oscillations propagate directly into the inverter’s DC-link capacitor. This generates significant voltage ripples and active power fluctuations, risking overcurrent trips and accelerated capacitor degradation—a high-cost failure point for any renewable system.
4. Why Solar Harmonics Can “Brake” Industrial Motors
One of the most counter-intuitive impacts of solar integration is how specific electrical “noise,” or harmonics, can physically interfere with industrial machinery. Through a process called Sequence-Network Harmonic Mapping, certain distortions created by inverters are injected into the grid in a reverse phase order (ACB).
The Harmonic Brake: Opposing the Momentum of Industrial Machinery
Negative-sequence harmonics—specifically those of the 5th, 11th, 17th, and 23rd orders—effectively rotate in the opposite direction of the grid’s standard flow. When these harmonics reach nearby industrial motors, they induce “counter-rotating braking torques.” This means the clean energy being fed into the grid is accidentally fighting against the physical rotation of industrial machinery, leading to severe rotor surface heating and mechanical inefficiency.
5. The Silent Overheating of Transformers
The complexity deepens when we consider Total Harmonic Distortion (THD). Solar inverters do not operate in a vacuum; instead, they interact with other single-phase non-linear loads, such as LED lighting and modern electronics. This combination leads to highly unbalanced levels of distortion across the three phases.
A specific category of this distortion, known as Zero-Sequence Harmonics or “Triplens” (3rd, 9th, and 15th orders), creates a different set of problems. These harmonics have zero phase displacement, meaning they are “in-phase” across the system. These currents are particularly dangerous for distribution transformers because of their “delta-connected” internal windings. The zero-sequence harmonics cannot leave these windings; instead, they circulate endlessly within them. The result is the silent, localized overheating of the transformer and excessive overloading of neutral conductors, significantly shortening the lifespan of critical grid infrastructure.
6. The 100 kW Turning Point: The New Engineering Standard
The physical risks of solar integration—from “braking” motors to burning out transformers—are precisely why regulatory bodies have established a firm line in the sand for larger installations. A critical engineering threshold has emerged: solar systems exceeding 100 kW are no longer allowed to be “passive” participants in the grid.
These larger systems are now required to be actively balanced across all three phases, with a maximum tolerance of only ±1 inverter string. To meet these demands, the industry is adopting the Decoupled Double Synchronous Reference Frame (DDSRF). Think of DDSRF as a high-speed digital filter and “mathematical brain” for the inverter. It allows the system to “see” the grid’s unbalance in real-time, estimating and eliminating 2ω oscillations. This enables the independent control of positive and negative-sequence currents, allowing the inverter to actively “damp” the unbalance on the grid rather than exacerbating it.
7. Conclusion: Beyond the Balanced Load
Integrating solar into our lives requires a fundamental shift in how we perceive electrical engineering. We can no longer rely on conventional “single-frequency” or “balanced loading” assumptions that served us for the last century.
As we move toward a decentralized energy future, the “intelligence” of the solar inverter becomes just as vital as the efficiency of the solar cell itself. The future of the grid depends on sophisticated power electronics that can manage the complex physics of an unbalanced system.
Are our current distribution grids ready for the complexity of a decentralized future, or is a total architectural overhaul the only way forward?
Exploring how legacy financial settlement windows distort modern grid physics and renewable economics.
1. Introduction: The High Cost of a Slow Clock
The physical reality of the power grid operates in milliseconds, but the financial systems governing it have traditionally moved at a snail’s pace. For decades, electricity markets have relied on the “slow” 60-minute financial hour to determine the System Marginal Price (SMP). This creates a dangerous friction: while electrons move at the speed of light to balance supply and demand, the “hourly” mindset masks the volatile reality of the modern grid.
As we transition toward a decarbonized world, this one-hour window is no longer a mere administrative convenience—it is a market distortion. Global energy markets are now shifting toward sub-hourly pricing, moving from 60 minutes down to 30, 15, or even 5-minute intervals. This evolution isn’t just about technical precision; it is a fundamental restructuring of how energy is valued. By aligning financial rewards with the high-speed requirements of grid physics, these new time-slices are rewriting the rules for renewables, batteries, and the bills on our desks.
2. The “Baseload Windfall” – How a 5-Minute Crisis Charges You for an Hour
In a traditional unbundled market, the most expensive generator required to meet demand—the “marginal unit”—sets the price for every other participant on the grid during that interval. This “uniform marginal pricing” model works well in theory but creates massive inefficiencies when the settlement window is too wide.
Take South Africa’s emerging wholesale market as a case study. When a coal unit trips or a solar ramp occurs unexpectedly, the System Operator may be forced to run an Open-cycle gas turbine (OCGT). These diesel-powered units are quick to start but extraordinarily expensive. If the OCGT runs for just five minutes to stabilize the frequency, under an hourly model, it sets a “sky-high SMP” for the full 60-minute block. Consequently, the entire low-cost baseload fleet is paid that emergency diesel rate for the full hour, even though the crisis was resolved in minutes.
Strategic analysis reveals this isn’t just a generation problem; it’s a curtailment trap. Currently, the System Operator (NTCSA) pays “Constrained Sales” compensation to Independent Power Producers (IPPs) when transmission bottlenecks limit their output. Because these payments are locked into 60-minute blocks, the operator often overpays for 10-minute bottlenecks as if they lasted an hour. Sub-hourly pricing “caps” this volatility by confining the price spike strictly to the interval when the expensive unit—or the constraint—actually exists.
“Eskom’s low-cost coal fleet currently benefits from these ‘massive financial windfall’ at the expense of distributors and consumers… This prevents short-term supply crunches from artificially inflating wholesale prices across the entire hour.”
3. The “30-Minute Average” Trap – Why Accuracy Can Actually Crash the Market
One of the most profound lessons in market design comes from Australia’s National Electricity Market (NEM). Before 2021, Australia operated under a mismatch: physical dispatch occurred every 5 minutes, but financial settlement was calculated as the average of those six periods (a 30-minute block).
This mismatch created a “destabilizing incentive.” If a supply constraint triggered a massive price spike in the first 5 minutes of a half-hour, the 30-minute settlement average would remain high regardless of what happened next. This signaled other generators to flood the market with energy for the remaining 25 minutes to chase that high average price. The result was a physical collapse: the over-response would crash real-time dispatch prices to the market floor of -$1,000/MWh while the financial settlement remained artificially inflated.
The Anatomy of a Timing Mismatch:
Cause: A supply constraint triggers a 5-minute price spike.
Effect: The 30-minute financial average remains high, creating a “phantom” price signal.
Result: Generators flood the grid, crashing physical dispatch prices to -$1,000/MWh and threatening grid stability.
“Shifting to unified 5-minute bidding and settlement aligns financial rewards directly with physical dispatch, eliminating these artificial price oscillations.”
4. The “Sawtooth” Pattern – Navigating the New Rhythm of Renewables
As markets in Europe transition to 15-minute intervals, analysts at Montel have identified the emergence of a “sawtooth” price pattern. This pattern is the market’s response to the rapid “ramping” of solar and wind assets.
Hourly blocks are a “blunt instrument” that fail to capture the steep solar ramps of early morning and late evening. In a 15-minute market, the “sawtooth” reflects intra-hour price spikes caused by fixed capacity allocations and the market’s attempt to correct itself in real-time. This granularity serves as a critical signal, incentivizing generators to shift their output to the exact minutes where the grid is under the most stress. In a high-renewables grid, profit is no longer found in volume alone, but in the ability to follow these rapid rhythmic shifts.
5. Batteries are Being “Diluted” by the Clock
The economic viability of a decarbonized grid depends on fast-acting assets like battery storage and demand-side response. However, the 60-minute hour acts as a “dilution” mechanism that actively discourages private investment.
A battery’s greatest value is its speed—its ability to discharge high-value energy during a critical 5-minute peak. Under hourly pricing, that high-value burst is mathematically smoothed and averaged out over 60 minutes, drastically reducing the battery’s earning potential. Strategic analysts argue that sub-hourly pricing is a non-negotiable prerequisite for the green transition. By rewarding “speed” over “volume,” granular pricing allows batteries to capture extreme short-duration peaks, finally making grid-scale storage a bankable investment rather than a subsidized experiment.
6. The “Data Tax” and the Shift of Risk to the Living Room
The move toward sub-hourly granularity is not a free lunch. It introduces significant administrative complexity and a fundamental shift in who bears the risk of price volatility.
The Data Overhead
Transitioning from 24 price points a day to 288 (in a 5-minute system) creates a massive “Data Tax.” Every interval must be recorded, validated, and billed, requiring a total overhaul of IT infrastructure.
The Complexity Cost
As seen in the UK’s Market-wide Half Hourly Settlement (MHHS) reform, moving to 30-minute settlement requires universal smart meter rollouts. For small businesses, this often means moving away from simple flat rates toward “bespoke contract negotiations” and higher standing charges.
Winners vs. Losers: This shift creates a divide between flexible and inflexible users. EV owners who can charge at 2:00 AM will see their costs plummet. Conversely, “inflexible” users—such as small manufacturers or hospitality venues that must operate during evening peaks—will be exposed to raw, volatile market pricing they cannot avoid.
7. Conclusion: Beyond the 60-Minute Mindset
The evolution of electricity markets marks the end of the unbundled monopoly and the rise of high-granularity competition. We are moving away from a world where we “blend” costs together and toward one where every five minutes has a unique value. Aligning financial rewards directly with physical dispatch is the only way to stabilize a grid that no longer relies on the steady hum of coal, but the variable breath of the wind and sun.
As these reforms take hold globally, from the UK to South Africa to Australia, the strategic implications for industry are clear. We are entering an era of radical price transparency. The question for any energy-intensive operation is no longer just how much power you use, but when you use it. In a world where the price of your primary input changes 288 times a day, can your current business model survive the new rhythm of the grid?